
In data analysis, trend is a very important aspect. Those of us who work with data in excel, have to look for patterns and give suggestions to stakeholders. In this case, identifying trends is necessary.
Trends are a general way of things without changing patterns not so much. Trendlines are lines created by excel that show the trend or the direction of the trend.
In excel, there are options for multiple trendlines. You can add multiple trendlines in excel after reading this article.
How to Add Multiple Trendlines in Excel?
So, let’s get started on the process of adding multiple trendlines in excel.
Where Can You Use Trendlines?
Before going on to add multiple trendlines in excel, you need to know where to use trendlines.
Trendlines can be used on multiple occasions but let me show you one of the most common uses of trendlines in excel.
Perhaps, trends are most useful in determining the movement of stock prices. Investors must try to identify the trend of a stock price movement before investing in that stock. Otherwise, they have to bear the risk of losing money.
Here, a certain stock’s price of 10 days is given.
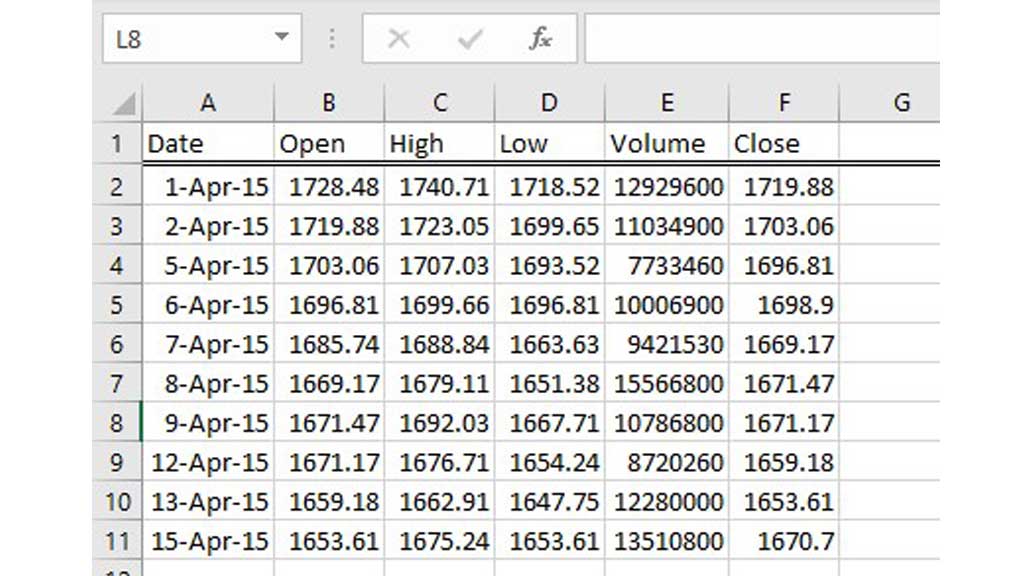
So, let’s see how we can add trendlines for its charts.
Creating the Chart to Add Trendline in Excel
To add a trendline in excel, we need a chart first.
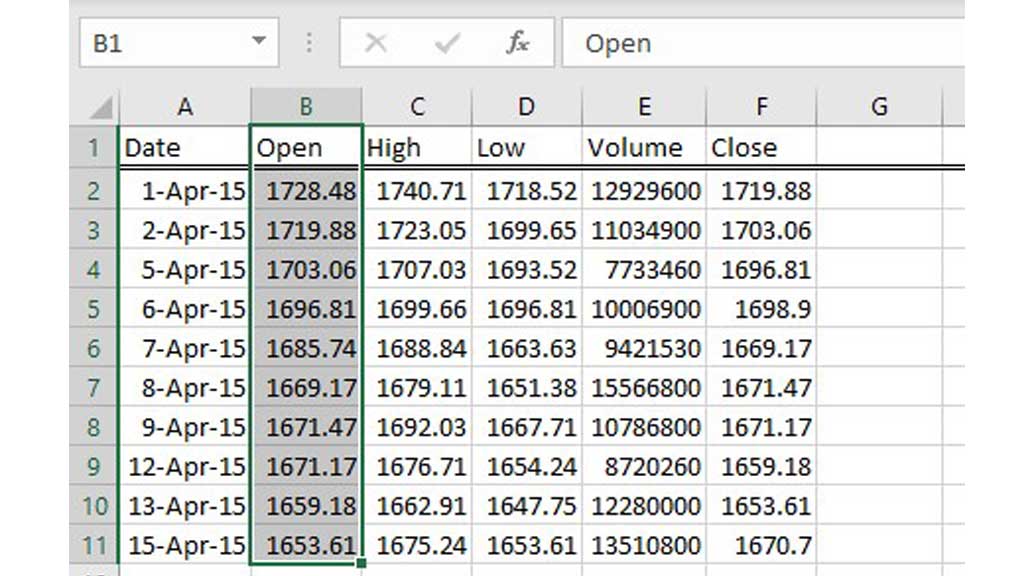
So, let’s create a trend for the opening price of that stock.
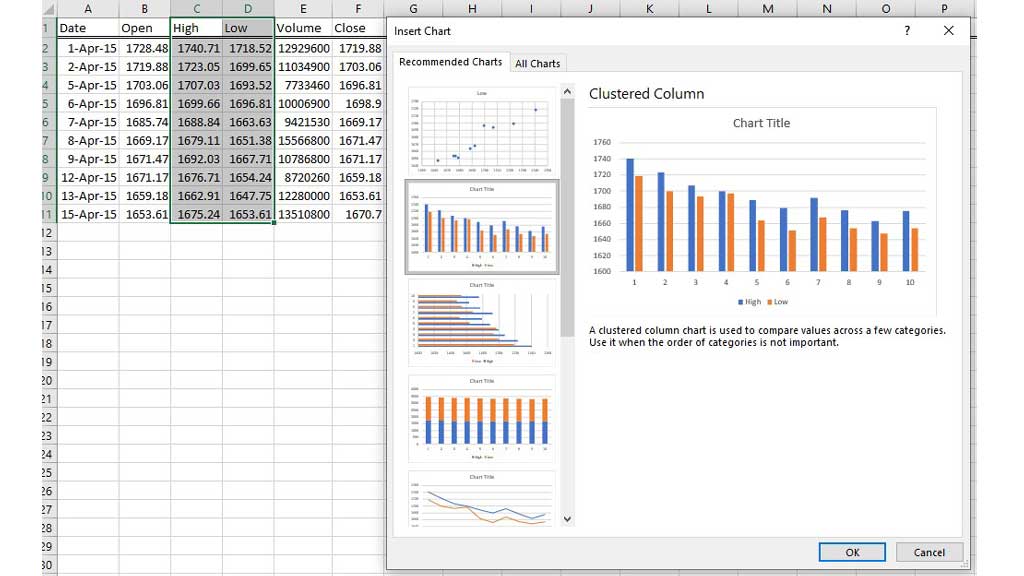
First of all, select the open column.
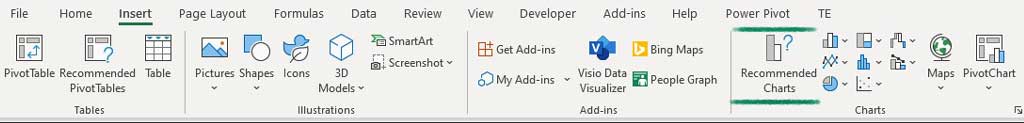
Then go to the “Insert” ribbon and go to “Recommended Charts”
From the dialogue box select the “Clustered Column” chart.
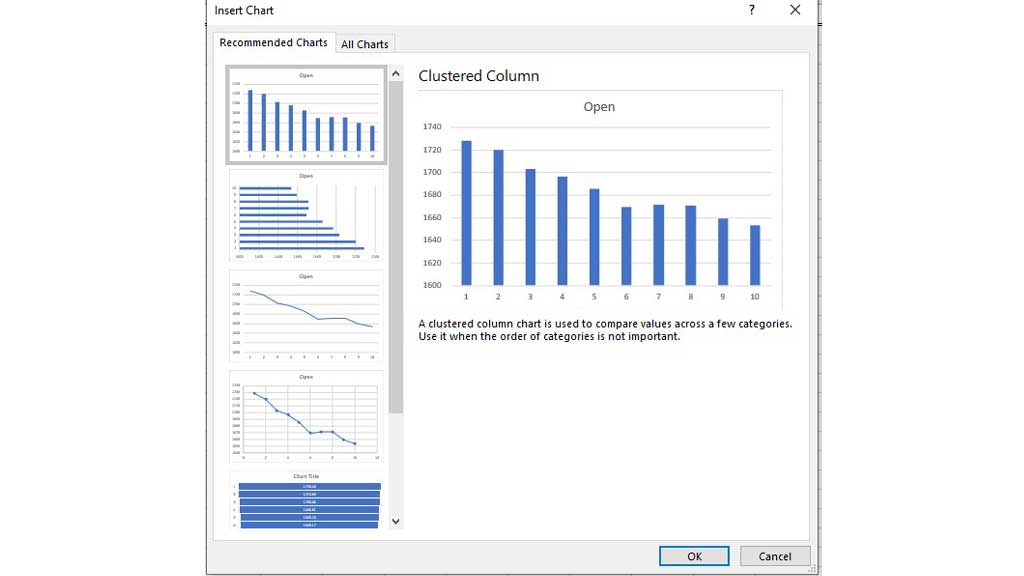
You will see the chart of the opening price of the stock.

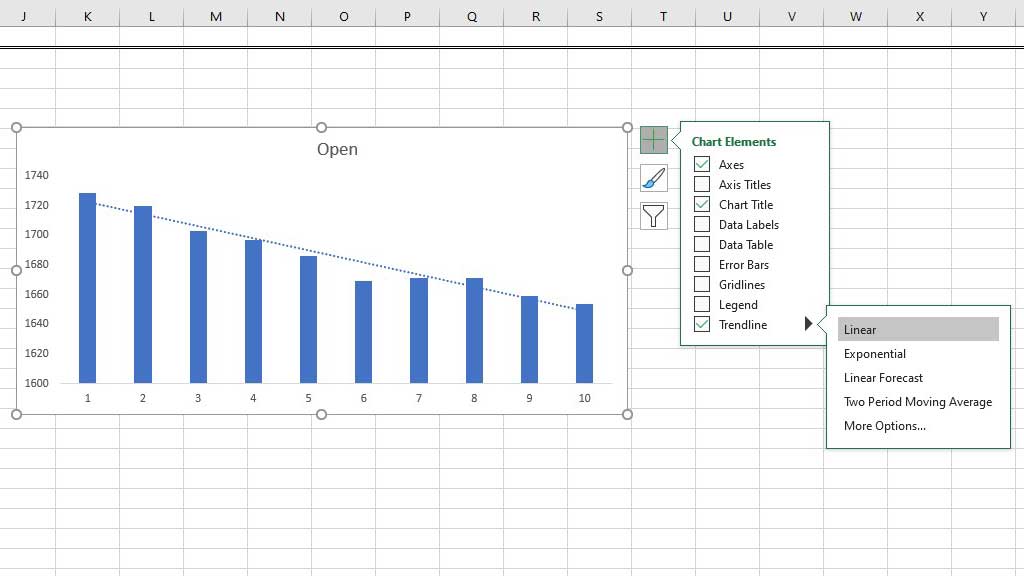
Adding the Trendline
There are two ways you can add the trendline in excel.
First, select the chart and you will see a green + sign at the outside of the top right corner of the chart. Select that and go to “Trendline” to add the trendline in the chart.
Or, after selecting the chart, go to the “Chart Design” ribbon and from the “Chart Layouts” Select “Add Chart Element” Then, select “Trendline” to add the trendline to the chart.

Adding Multiple Trendlines in Excel
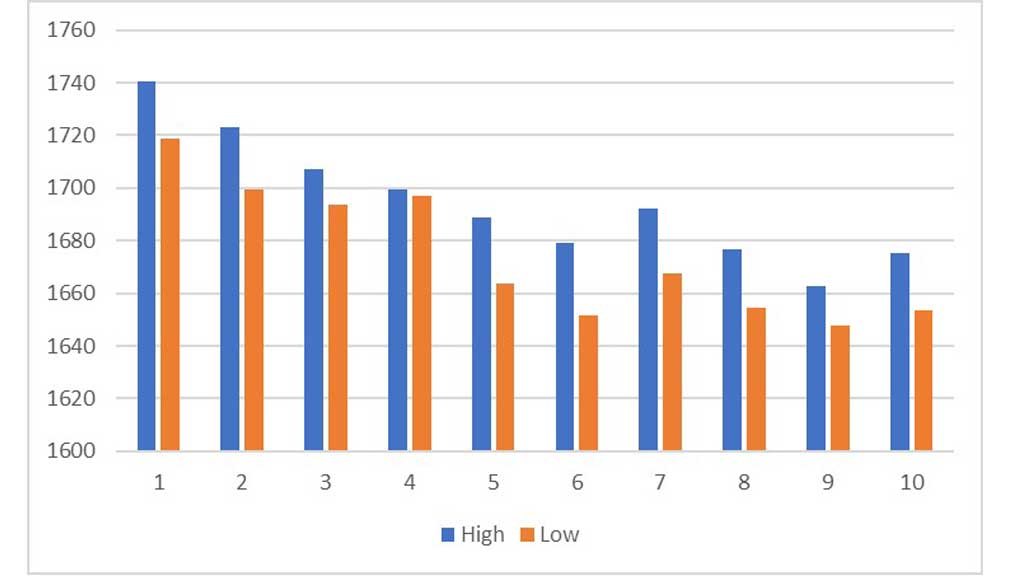
You can also add more than one trendline in excel. First, make a chart by selecting the columns of data.
This chart shows the high and low prices of the stock.
Now similarly use any of the methods to add “Trendlines” Excel will ask you for which data you want to create the trend.
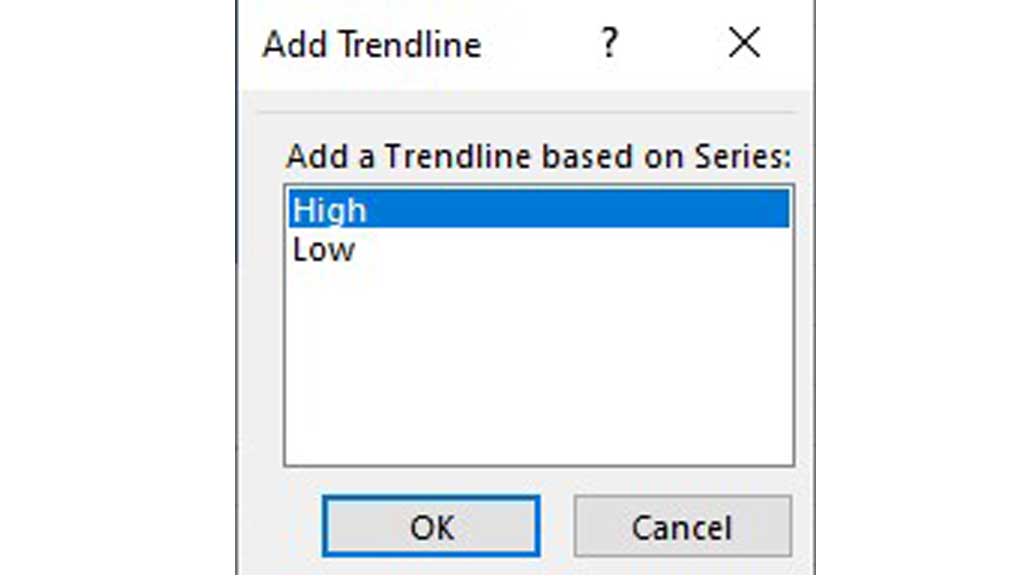
First, select high and click ok. And again, repeat the process to select low and click ok.
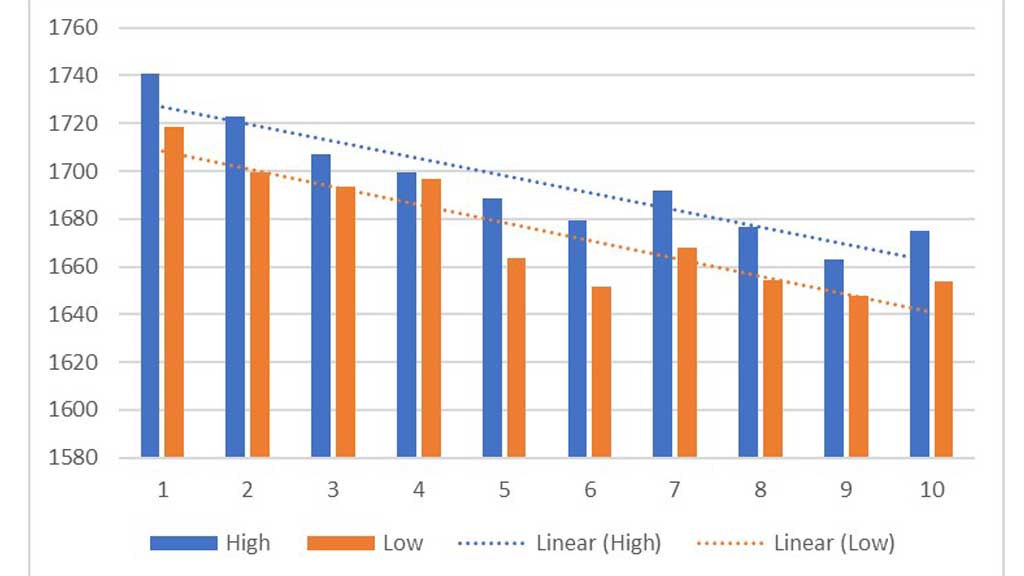
And voila, you have successfully added multiple trendlines in excel.
Managing and Editing multiple trendlines in Excel
You can also edit and manage the multiple trendlines you have added in excel. Select the trendline you want to edit or manage and go to “Trendline options”
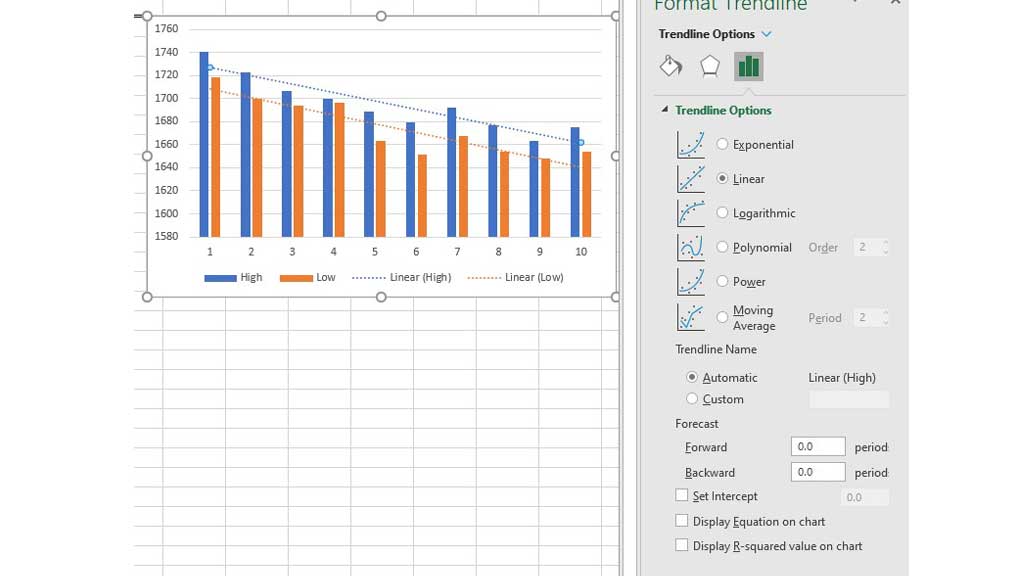
From this option, you can choose what type of trendline to add. You can also forecast up to a certain period.
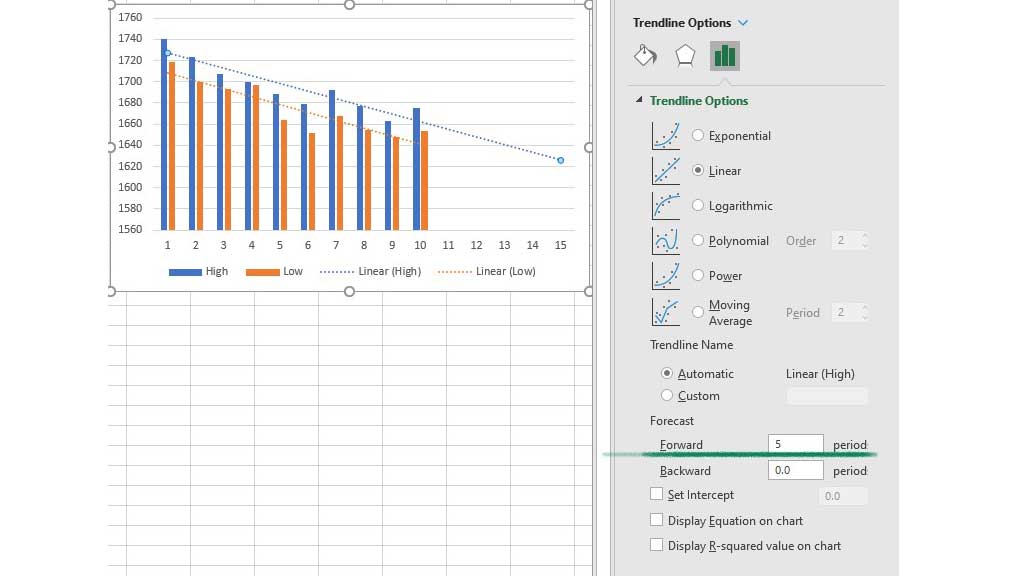
As an investor, I want to see where my stock’s price can go in the 5 years future. To see that, just add the number of periods you want to forecast, in this case, 5 and you will see the trendline extend 5 years in the future.
Pointers from the author: Trendlines has quite a lot of advanced features. You can add the r-square value of the trendline to see how fit the model is. You can also add more than 2 trendlines to visualize the trend better.
So, this is how you can add multiple trendlines in excel. You can also manage and edit some advanced features of the trendlines.

Hi there, I am Naimuz Saadat. I am an undergrad studying finance and banking. My academic and professional aspects have led me to revere Microsoft Excel. So, I am here to create a community that respects and loves Microsoft Excel. The community will be fun, helpful, and respectful and will nurture individuals into great excel enthusiasts.