Microsoft Excel can be a very good tool for investors. Investors can build and maintain their portfolio in excel very easily.
The easiness of doing mathematical operations can be used to calculate portfolio returns, forecasts, etc.
The movement of prices or rates in financial markets can be measured by basis points.
So, investors need to calculate basis points to evaluate and identify trends and forecasts for various financial securities and instruments.
As they work with long streams of data, excel can be really useful in this case.
So today, let’s learn how to calculate basis points in excel.
What are Basis Points?
BPS or Basis Points are a unit of measurement. It is very commonly used in finance and economics to measure the change or movement in interest rates and percentages.
One basis point is equal to one hundredth of 1%. basically, one basis point equals .01% or 1/1000.
| Basis Points | Percentage Terms |
|---|---|
| 1 | 0.01% |
| 5 | 0.05% |
| 10 | 0.10% |
| 50 | 0.50% |
| 100 | 1% |
| 1000 | 10% |
| 10000 | 100% |
The most common use of basis points is in financial markets where it tracks the movement or change of an instrument’s price.
How to Calculate Basis points in Excel?
To calculate basis points, you first have to identify the change in percentage. Then you can multiply it by 10000 to get the basis points.
So, let’s see how to calculate basis points in excel.
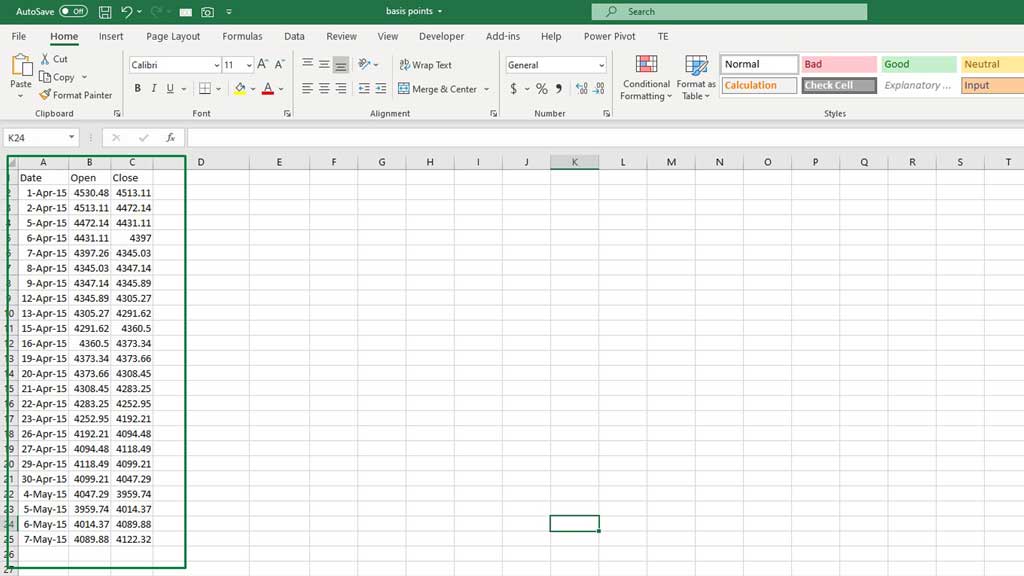
Step#1 Create a Table for the Prices
The table in the picture contains three elements. The opening and closing price of a stock and the date.
Step#2 Calculate the Percentage Change
To calculate the percentage change type the following formula:
=(C2-B2)/B2
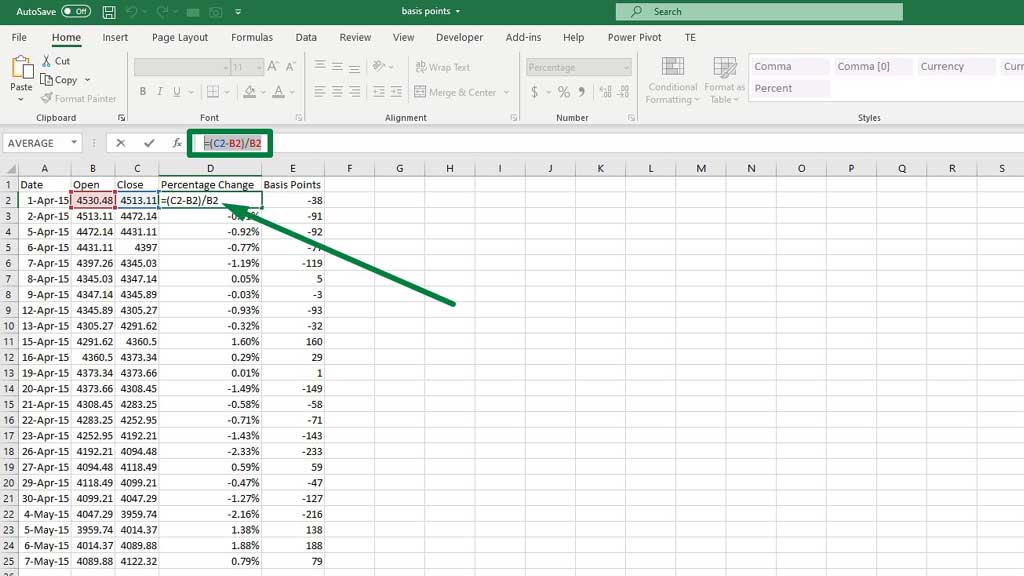
The formula essentially means that, you have to subtract the closing price from the opening price and then divide the result by the opening price.
This determines the change of price in respect to the opening price.
Drag the fill handle down to get all the percentage changes
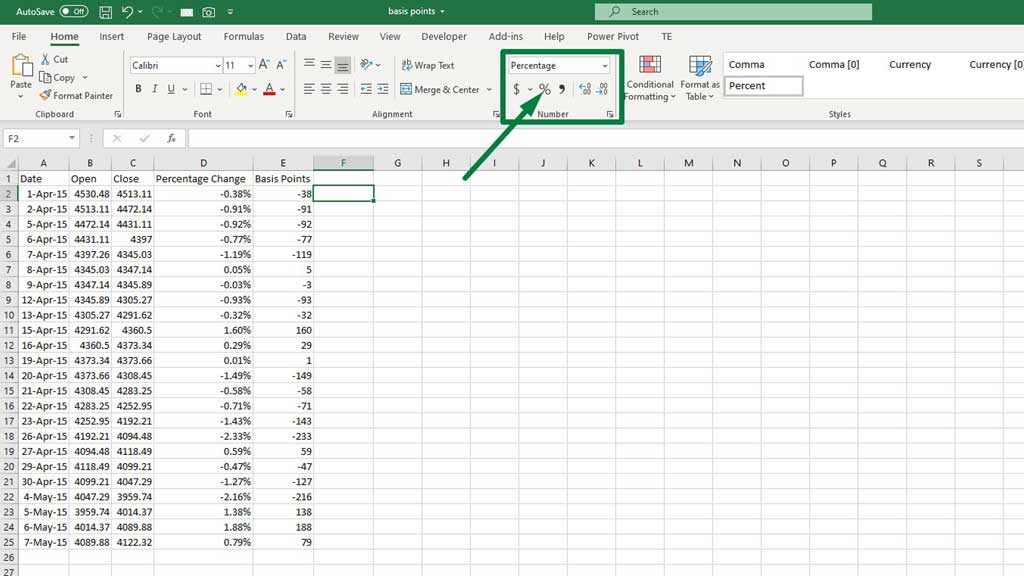
Step#2 Calculate the Basis Points
To calculate the basis points, simply multiply the percentage changes by 10000. So, the formula is:
=D2*10000
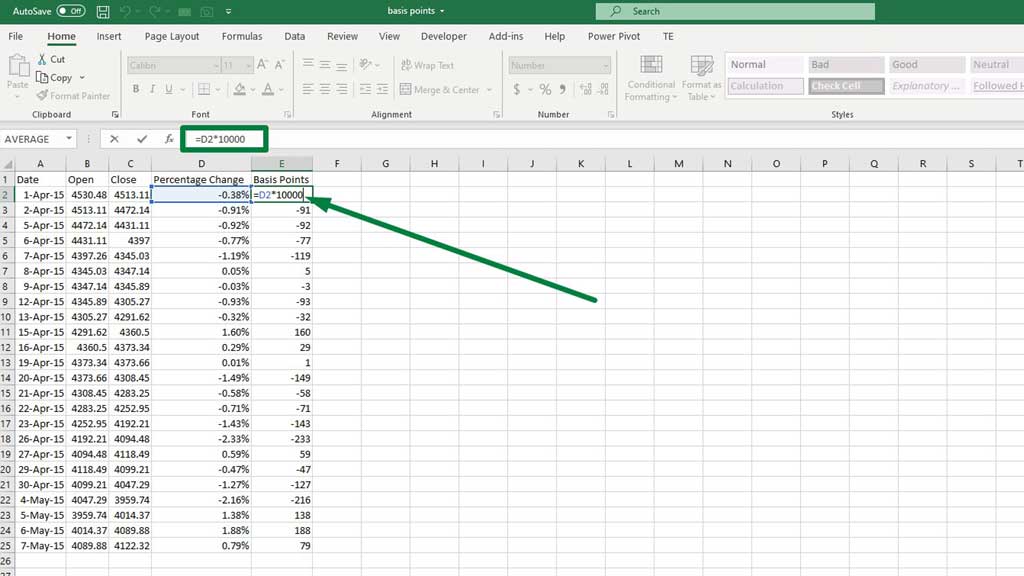
Drag the fill handle down to get all the basis points.
A basis point of -38 means that the price has decreased 38 basis points or .38% from its previous price.
While a basis point of 5 means that the price has increased 5 basis points or .05% from its previous price.
Similarly, you can convert basis points to percentage changes by dividing the basis point by 10000.
Conclusion
So, that’s it. Calculating basis points is very easy in Microsoft excel. Investors, bankers, or professionals in similar fields of finance and economics can use excel to calculate basis points in excel, make processes easier and faster.
So, there you go, now you know how to calculate basis points in excel.
Related Article:

Hi there, I am Naimuz Saadat. I am an undergrad studying finance and banking. My academic and professional aspects have led me to revere Microsoft Excel. So, I am here to create a community that respects and loves Microsoft Excel. The community will be fun, helpful, and respectful and will nurture individuals into great excel enthusiasts.