Cost and benefit analysis is a major part of finance and economics. Professionals in the sectors always think about the benefits and the welfare of the involved party and what cost it will incur to get those benefits before implementing a project or policy.
There are many measures of cost and benefits depending on the context and type of the project, policy, etc.
In the world of finance, one such measure is the profitability index or PI. It is sometimes known as value investment ratio (VIR) or profit investment ratio (PIR).
This measure or ratio is used in project financing.
Companies and organizations frequently need to uptake new projects for different purposes like new product lines, infrastructural development, etc.
In this case, the profitability index is measured before implementing a project.
So, let’s learn how to calculate profitability index in excel.
What is Profitability Index?
Profitability is used to find out whether a project is profitable or not.
The measure or the ratio is calculated between the present value of future expected cash flows and the initial amount invested in the project.
So, the formula is:
Profitability Index=(NPV or PV of Future Cashflows)/(Initial Investment)
The present value of the future cash flows is also known as the net present value or NPV.
NPV is calculated by discounting the future cash flows by a discounting factor. The discounting factor is the cost of capital.
If the PI is more than 1 the project should be accepted, if the PI is less than 1 the project shouldn’t be accepted as it will give a negative return.
A PI of 1 is the lowest acceptable measure. A PI of 1 indicates that the project will just break even.
Calculating profitability index manually is very tedious and time consuming, as you have to discount multiple future cash flows. But in excel the process is very easy and simple.
So, let’s learn how to calculate profitability index in excel.
How to Calculate Profitability Index in Excel?
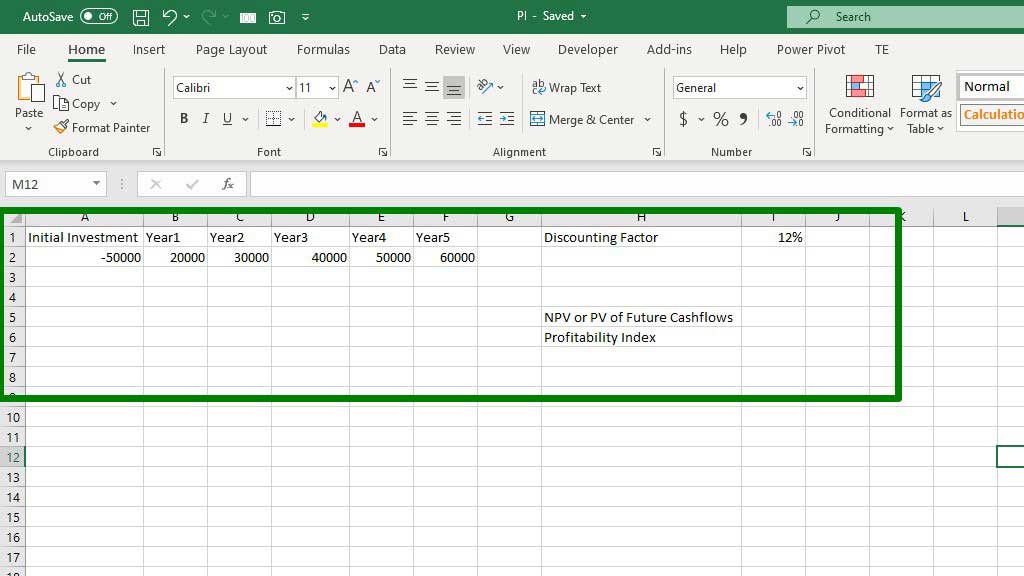
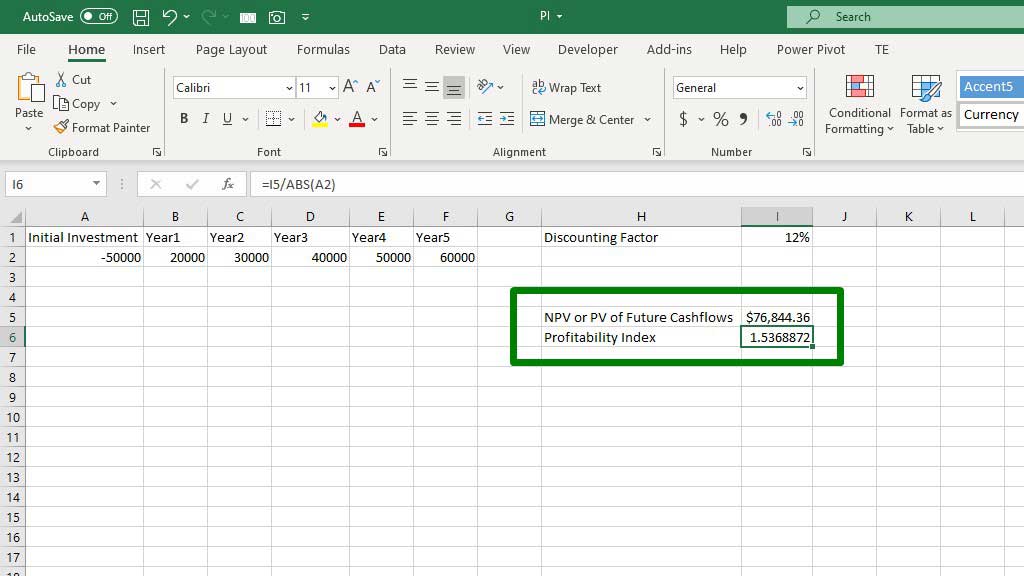
First, create the distribution of future cash flows, initial investment and set a discounting rate which is the cost of capital.
The initial investment is negative because the first cash flow is going out. The future cash flows are coming in.
This is a 5-year profitability index. Usually, as you go more in the future, the measure of profitability index becomes more vulnerable to being wrong as measuring the cost of capital in the future is very difficult and it is one of the most uncertain things in the world.
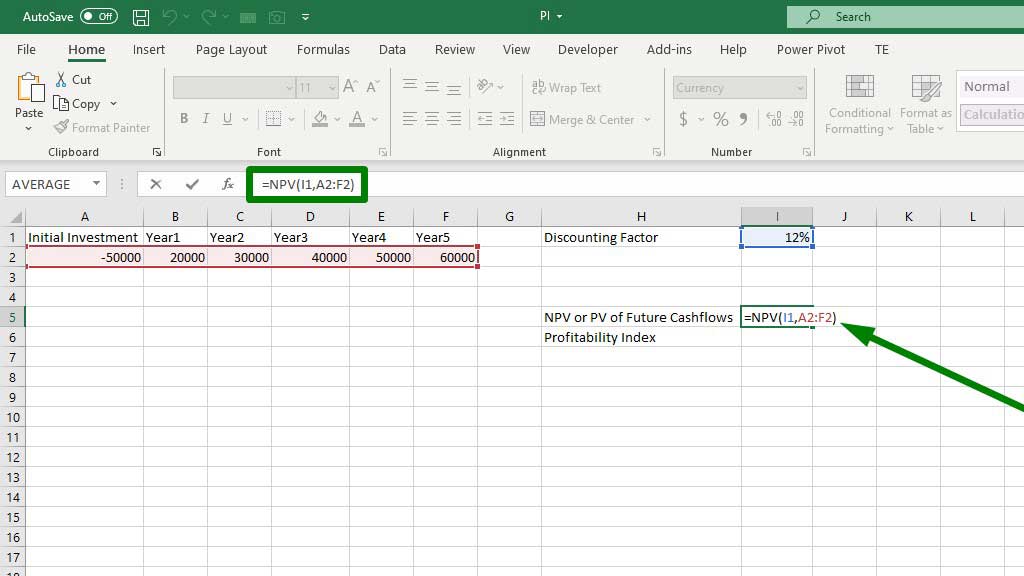
Now, to calculate the NPV, type the following formula:
=NPV(I1,A2:F2)
Now, it’s time to calculate the profitability index. Type the following formula to calculate PI:
=I5/ABS(A2)
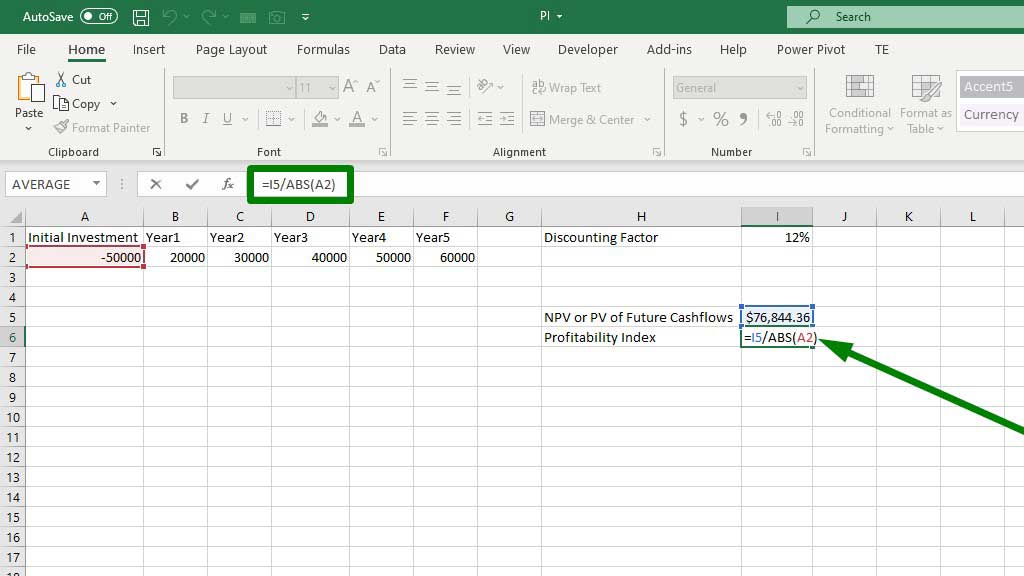
There you go, your profitability calculation in Excel is ready. You will see that the PI is more than 1 which indicates that the project is profitable, and you can accept that.
Conclusion
Profitability index can be used to rank multiple projects. The ranking can help project financiers to decide which project to implement and which to discard.
It is also quite accurate in measuring the profitability of a project as it considers the cost of capital and discounts the future cash flows.
These features make PI widely used in the finance world.
As now you also know how to calculate profitability index in excel, you can use it on your own.

Hi there, I am Naimuz Saadat. I am an undergrad studying finance and banking. My academic and professional aspects have led me to revere Microsoft Excel. So, I am here to create a community that respects and loves Microsoft Excel. The community will be fun, helpful, and respectful and will nurture individuals into great excel enthusiasts.