
The versatility of excel while analyzing and visualizing data is known to all. We have tried to justify how it is very easy to work with graphs and charts in excel in our previous blogs.
We have shown how to work with pie charts, bar charts, column charts, etc. We have also shown customizable creative graphs and charts like the burndown chart, stem and leaf plot, supply and demand graph, etc.
All these graphs and charts have their own way of visualizing data, and we can easily analyze and make a decision by taking a look at them.
While making a graph is easy in excel, but what happens if you want to change the type of chart in excel?
So, let’s see how to change chart type in excel.
What is changing a chart type?
Converting one type of graph to another type without deleting the original graph in excel, is known as changing the chart type in excel.
If you have mistakenly made one type of graph that does not go with the requirements of the clients or the type of data, you are trying to visualize then you can easily change the chart type without making a whole new graph.
For example, if you have made a column chart but later you realize that a pie chart would go better with the type of data you are working with, you can easily change the type of the chart without deleting it.
So, let’s see how to change chart type in excel.
How to Change Chart Type in Excel?
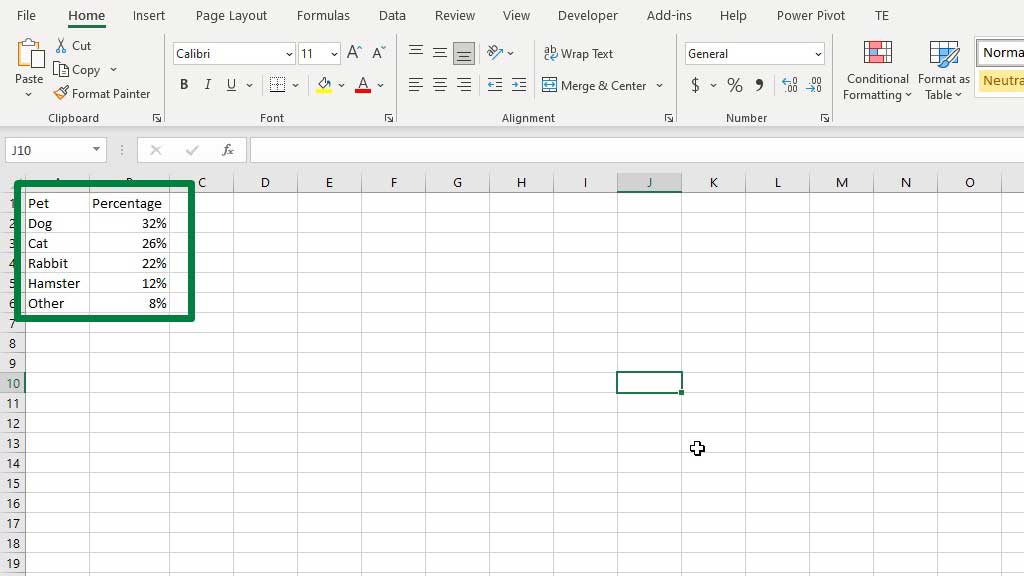
First, let’s, make a column chart from the data.
Select the data, then from the Insert tab, go to Recommended Charts and select a Column Chart.
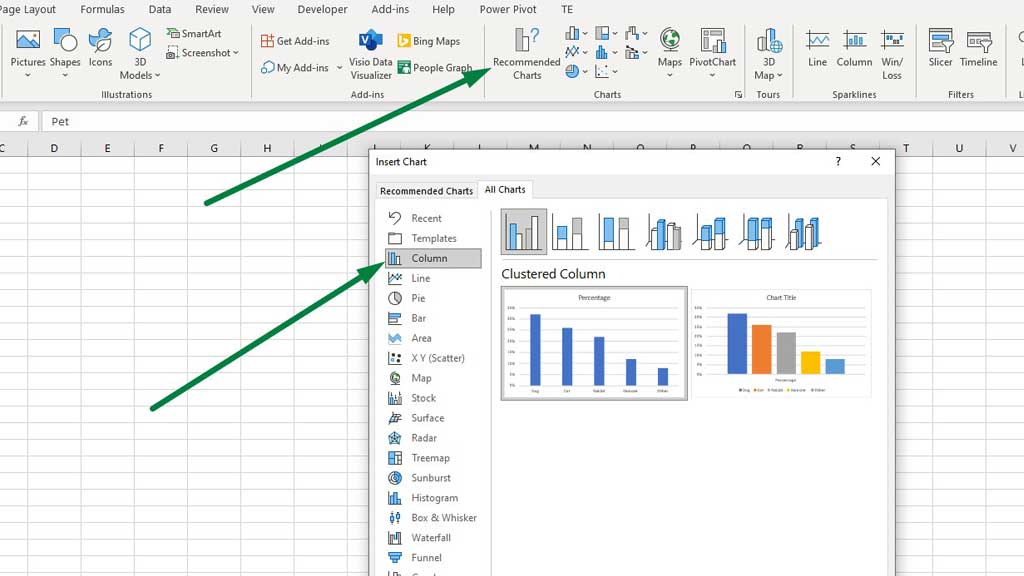
Press ok and you will see that you have successfully created a column chart.
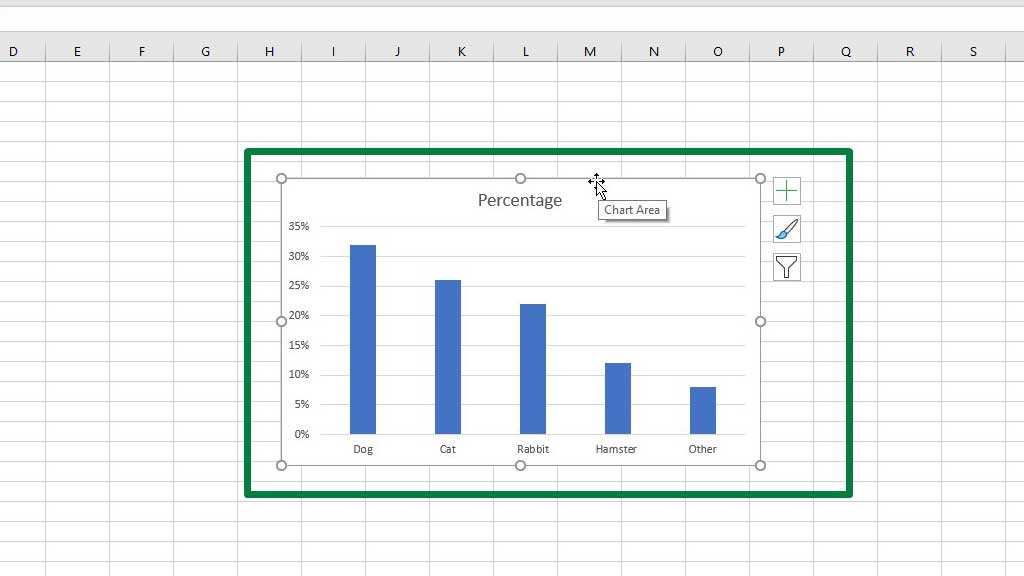
However, the kind of data we are working with here does not fit the column chart. As the data is about the percentage of the type of pet owned by different people, so a pie chart would be more appropriate here.
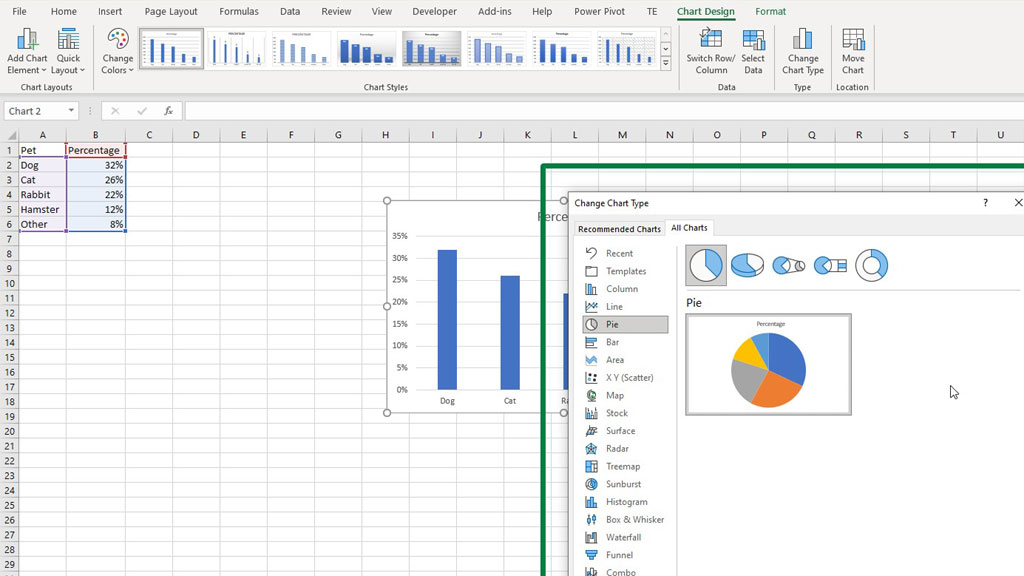
So, to change the chart type and convert the column chart into a pie chart, first select the column chart, then go to the Chart Design tab.
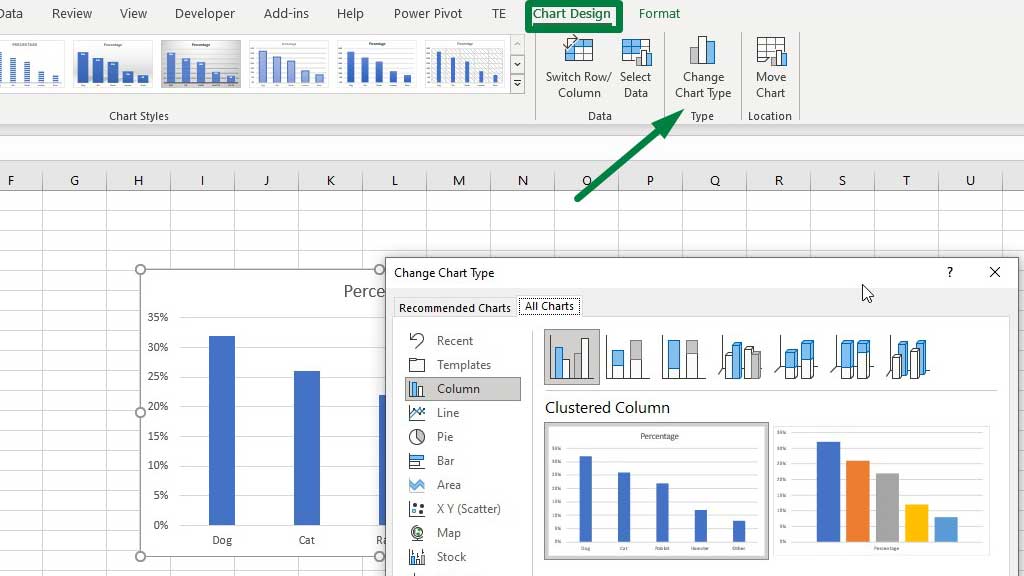
You will get a similar dialogue box as you get from recommended charts section. Now, select your preferred chart in this case a pie chart, and then press ok.
And voila, you have successfully converted the column chart into a pie chart that is you have changed the chart type.
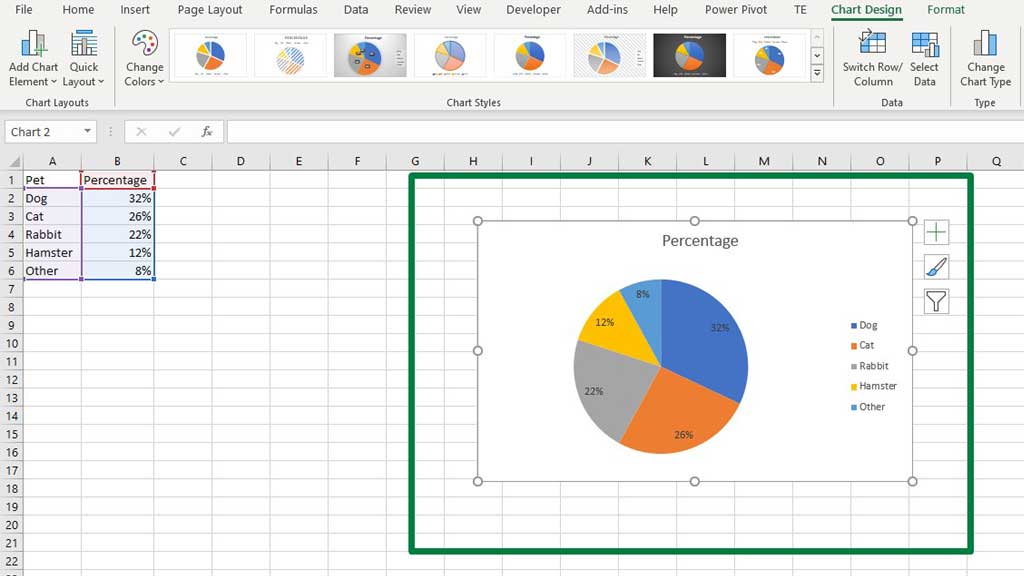
In this way, you can easily change a chart type in excel.
Conclusion
As always working with charts and graphs is always easy, fast, and efficient in excel.
As now you know how to change a chart type in excel, even if you make a mistake while selecting a chart type you can easily convert it into another type as per your requirement and preference.

Hi there, I am Naimuz Saadat. I am an undergrad studying finance and banking. My academic and professional aspects have led me to revere Microsoft Excel. So, I am here to create a community that respects and loves Microsoft Excel. The community will be fun, helpful, and respectful and will nurture individuals into great excel enthusiasts.