
There are various statistical measures that help to analyze data. In a previous blog, we learned to calculate mean, median, and mode in excel. They are the measures of central tendency which is a very important aspect in statistics.
Today, we will learn how to find an interquartile range in excel.
The interquartile range is another important aspect of descriptive statistics. To know about interquartile range, first, we need to learn what percentiles are.
What Are Percentiles?
Percentiles are also a measure in statistics that compares a score or data point with other data points in the same set.
It’s typically used as a certain percentage that falls below a specific value, data point, or score in the data set.
For example- If a teacher says to one of his/her students that he/she scored in the 90th percentile, it means that he/she has scored 90% more than the rest of the class.
To find a percentile, you need to sort the data set from smallest to largest. You can find the 90th percentile in the data set by multiplying percent(k) with the total number of data (n). Let’s assume the numbers are 1 to 100. So, the total is 100.
In this case,
K x n = .9 x 100.
So, the student scored 90.
What are Quartiles?
The 25th percentile is called the first quartile, the 2nd quartile is also known as the median or the 50th percentile, the third quartile is the 75th percentile and finally, the 100th percentile is known as the 4th quartile.
These quartiles and percentiles are the measures of dispersion or spread of data. As per the previous example, the 2nd quartile or the 50th percentile score indicates that if a student scores at the 50th percentile, he/she has scored more than 50% of the students.
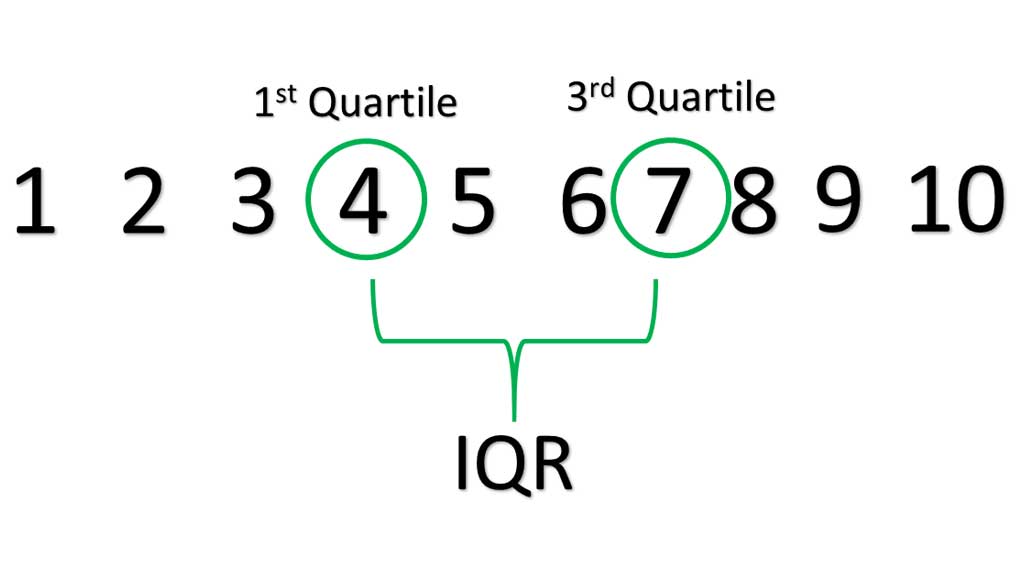
What is Interquartile Range?
The interquartile range is the difference between the third quartile (75th percentile) and the first quartile (25th percentile).
So, the formula is:
IQR= Q3-Q1.
The interquartile range is the spread of data in the middle of the data set. Essentially, it tells us which data points are situated at the center of the data set.
So, let’s learn how to calculate interquartile range in excel.
How to Find Interquartile Range in Excel?
Step#1 Calculate the First Quartile
There is a range of dollars given in the picture. You don’t have to sort the data from smallest to largest to calculate the percentile. Just type the formula below to calculate the first quartile in excel:
=QUARTILE.INC(A2:A11122,1)
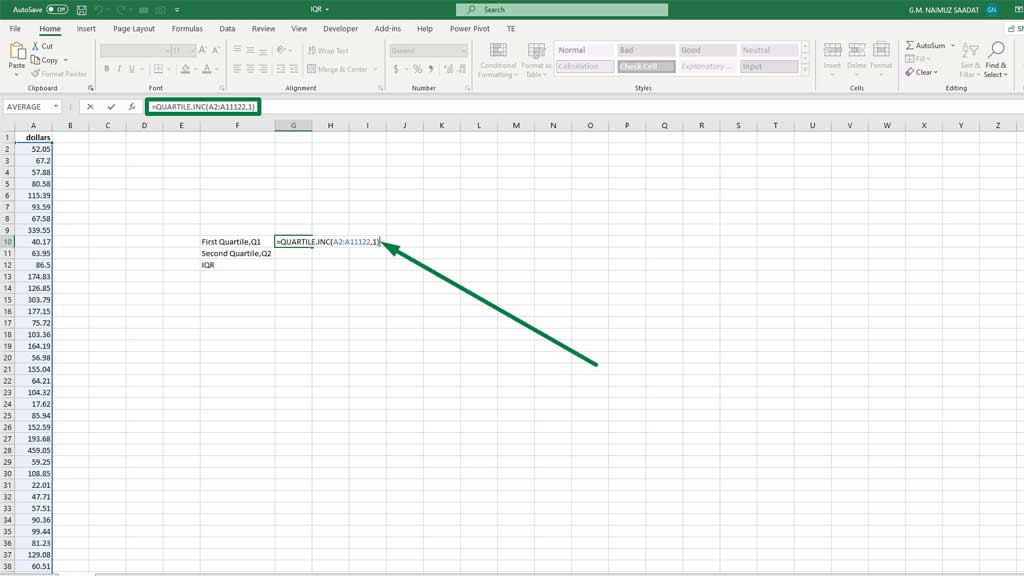
Press enter and you will see that the first quartile is 64.75.
Step#2 Calculate the third Quartile
Type the formula below to calculate the third quartile in excel:
=QUARTILE.INC(A2:A11122,3)
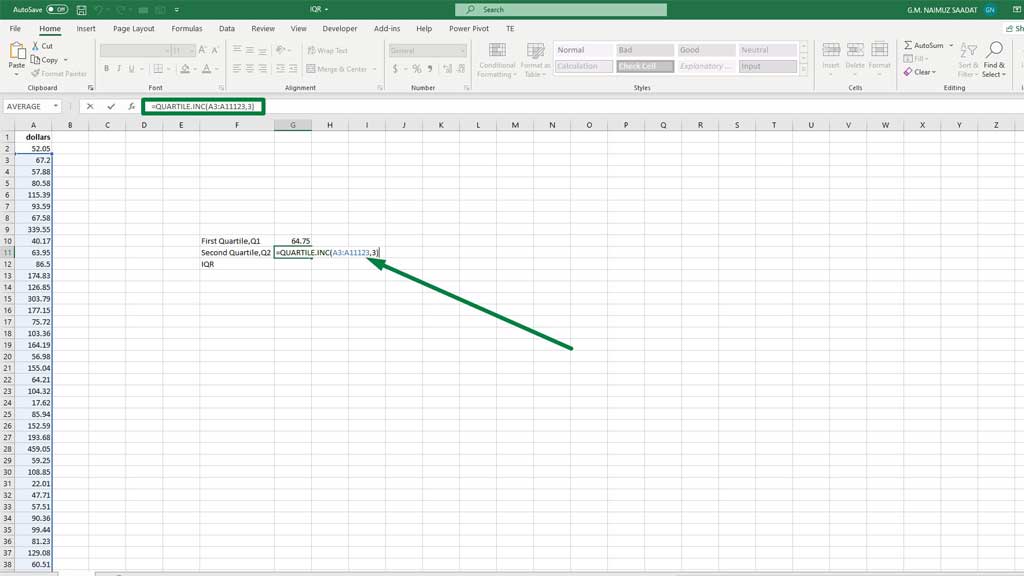
Press enter and you will see that the first quartile is 128.08.
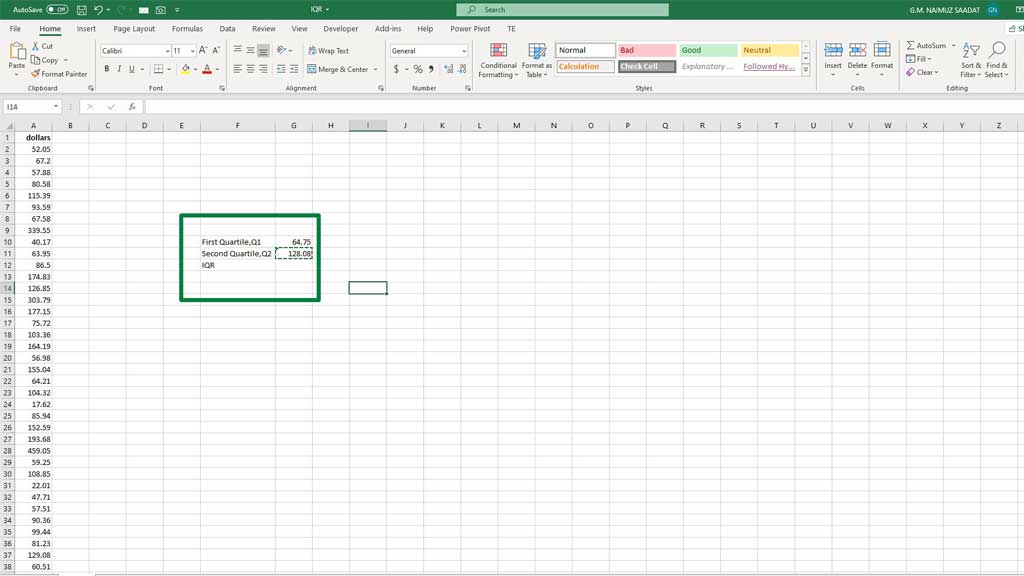
Step#3 Calculate the Interquartile Range
Now, subtract the first quartile from the third quartile to get the interquartile range. Type the following formula:
=G11-G10
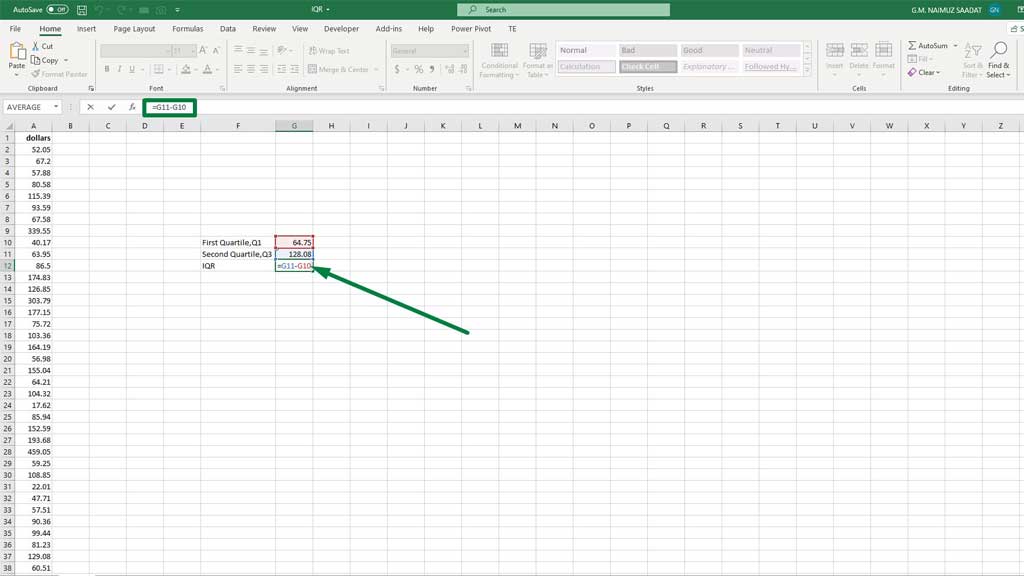
Press enter and you will see that the interquartile range is 63.33.
Note: You also can type the formulas together to get the interquartile range. The formula would be:
=QUARTILE.INC(A4:A11124,3)-QUARTILE.INC(A2:A11122,1)
Conclusion
Interquartile ranges are measures of data dispersion in the middle of a data set. It is widely used in descriptive statistics.
So, there you go, you know how to find an interquartile range in excel.

Hi there, I am Naimuz Saadat. I am an undergrad studying finance and banking. My academic and professional aspects have led me to revere Microsoft Excel. So, I am here to create a community that respects and loves Microsoft Excel. The community will be fun, helpful, and respectful and will nurture individuals into great excel enthusiasts.