
Visualizing data in Microsoft Excel is easy, efficient, and appealing to the eyes. It helps people grasp the potential impact of data analysis even more.
You can graph equations and functions, make Venn Diagrams, Stem and Leaf Plots, Supply and Demand Graphs, Burndown Charts, and many more in Excel.
However, you may not always need the graph displayed in excel. You may need to print it separately to show your manager or clients, or you need an image version of the chart you created.
So, knowing how to convert an excel graph or chart into an image is necessary.
So, let’s see how to save an excel graph or chart as an image.
How to Save an Excel Graph or Chart as an Image?
There are two scenarios where you need to save an excel chart as an image. First, you could have only one graph that you want to save as an image, and there could be multiple graphs that you want to save as images.
So, let’s look at them one by one and learn how to save an excel graph or chart as an image or a picture.
You can learn more about making charts and graphs from the hyperlinked sections mentioned in the introduction.
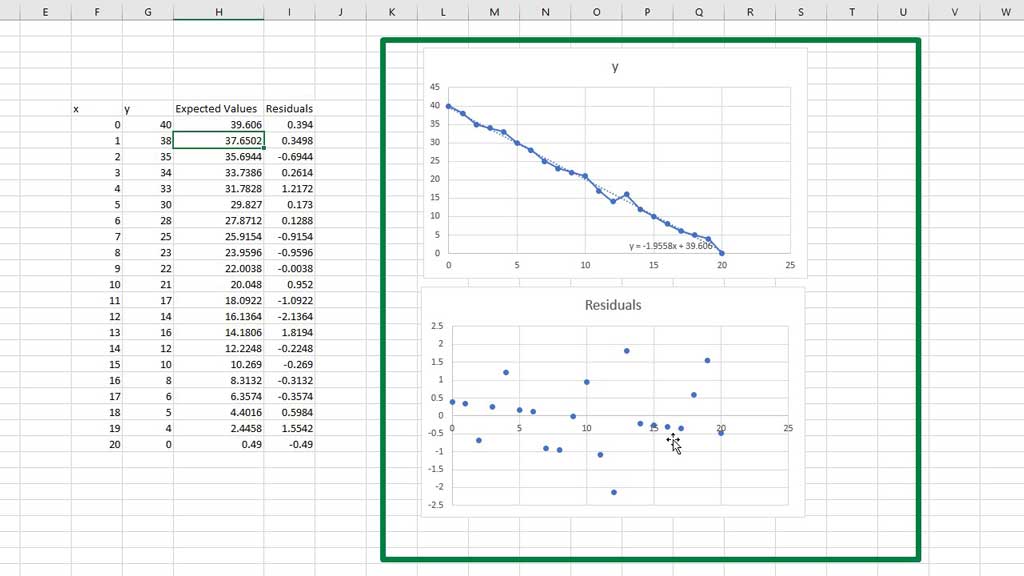
For now, let’s assume the charts and graphs have already been created.
How to save one excel chart as an image?
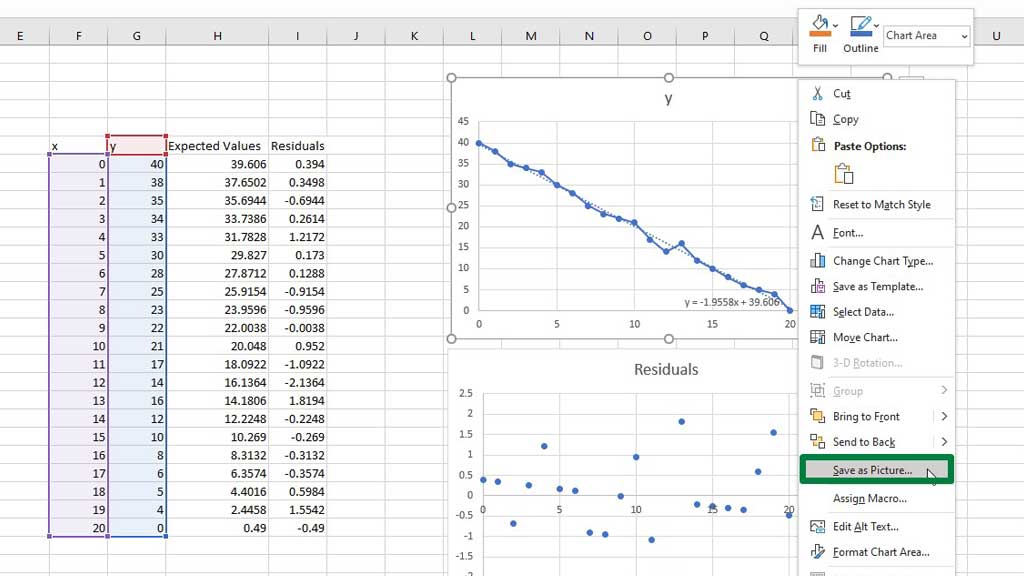
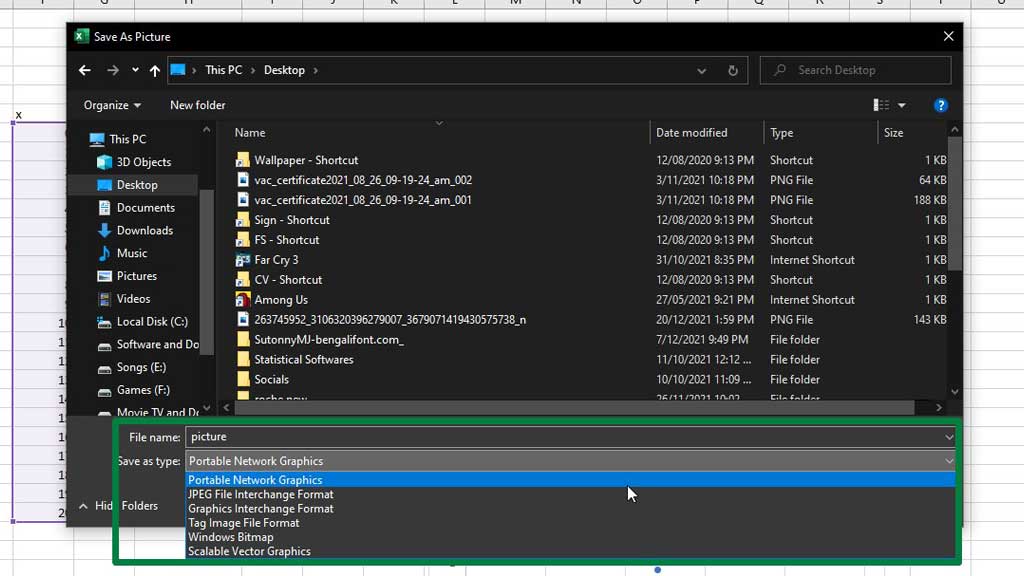
Right-click on the graph you want as an image or picture and select Save as Picture.
You will get the option to name the image, where you want to save the picture, and which image type you want (.bmp, .jpg, .png, .gif).
Press Save, and you will get your image at your designated location.
How to save multiple excel charts as images?
Now, if you have multiple excel charts and graphs, you can convert those graphs or charts into images in the same way. However, this would take a lot of time because you have to save them individually.
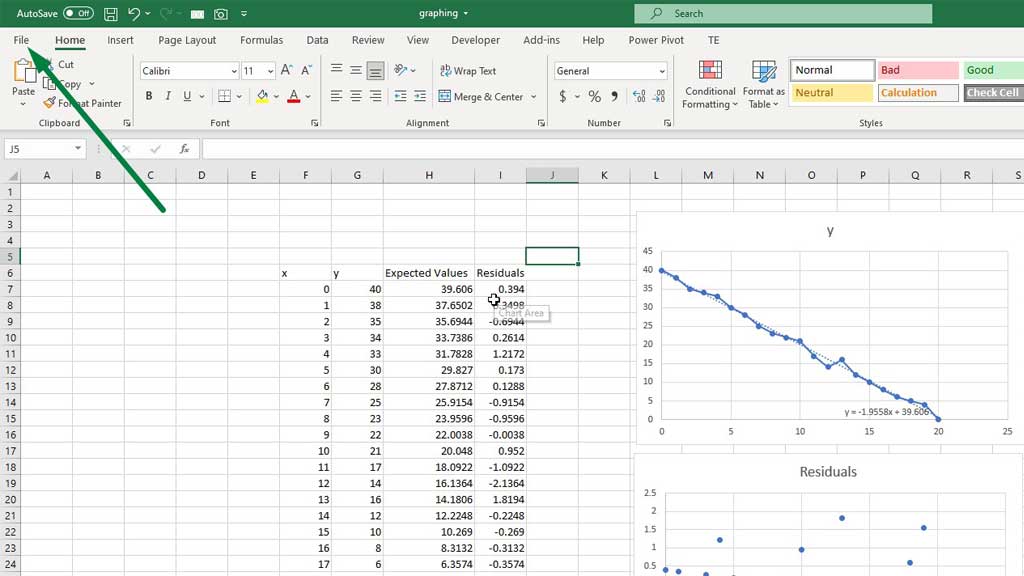
So, what you can do is, you can save the excel file as an Html file. To do that, I got to File.
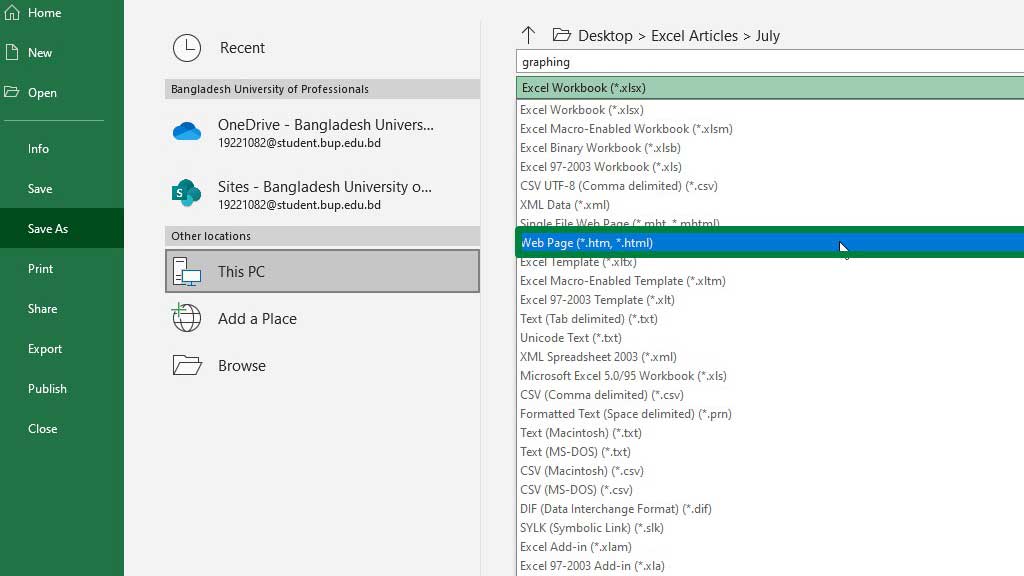
Then from Save As an option, save the excel workbook as an Html file.
You can select the location where you want to save the file. Now, if you go to the folder, you can see that all graphs and charts in your workbook have been saved as images.
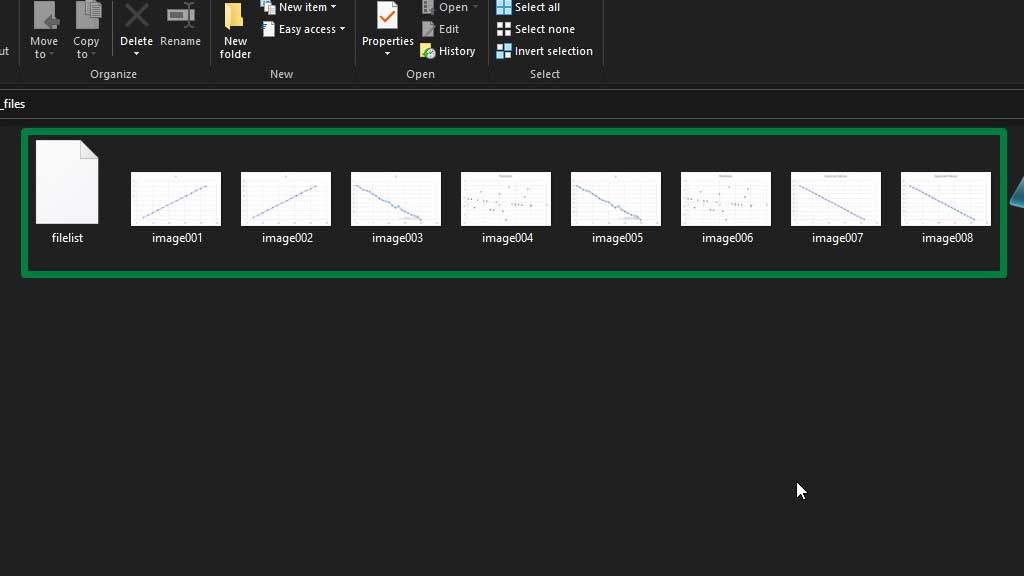
The type of the images will be png.
The image file types available to save the graphs are as-
Device Independent Bitmap (.bmp )- This file format is accessible on multiple platforms (mac, os) precisely as the original program.
Graphics Interchange Format (.gif) – Supports 256 colors, lossless compression, and loses no image quality.
JPEG File Interchange Format (.jpg) – Has a tradeoff between storage space and image quality. Users can adjust the rate by changing compression and reducing storage size.
Portable Network Graphics Format (.png) – Improves the quality of graphics on a website because parts of the image can be transparent, and brightness can be controlled.
So, there you go now you know how to save an excel graph or chart as an image.
Conclusion
Excel’s innovative feature of saving a graph as an image is a perfect example of how excel is versatile and a great data management software. You can display graphs and charts on excel worksheets and save them as images and use them per your requirement.
As now you know how to save an excel graph or chart as an image, you can work with graphs and charts more quickly and if required, print them out in a high-quality image format.

Hi there, I am Naimuz Saadat. I am an undergrad studying finance and banking. My academic and professional aspects have led me to revere Microsoft Excel. So, I am here to create a community that respects and loves Microsoft Excel. The community will be fun, helpful, and respectful and will nurture individuals into great excel enthusiasts.