The importance of graphs is known to us all. For us, data enthusiasts, graphs, or charts are like the gold standard. It makes our lives easier, faster, and more efficient than ever before.
But what happens when you know you have upcoming assignments, but you don’t have the data to plot the graph. Your supervisor or professor will provide the data later.
Well, you can make a template of the graph and make necessary preparations way before the deadline and make your work faster.
How to Graph an Equation in Excel Without Data?
let’s see how we can make the graph of an equation in Excel without using data.
#Step 1- Input the Equation
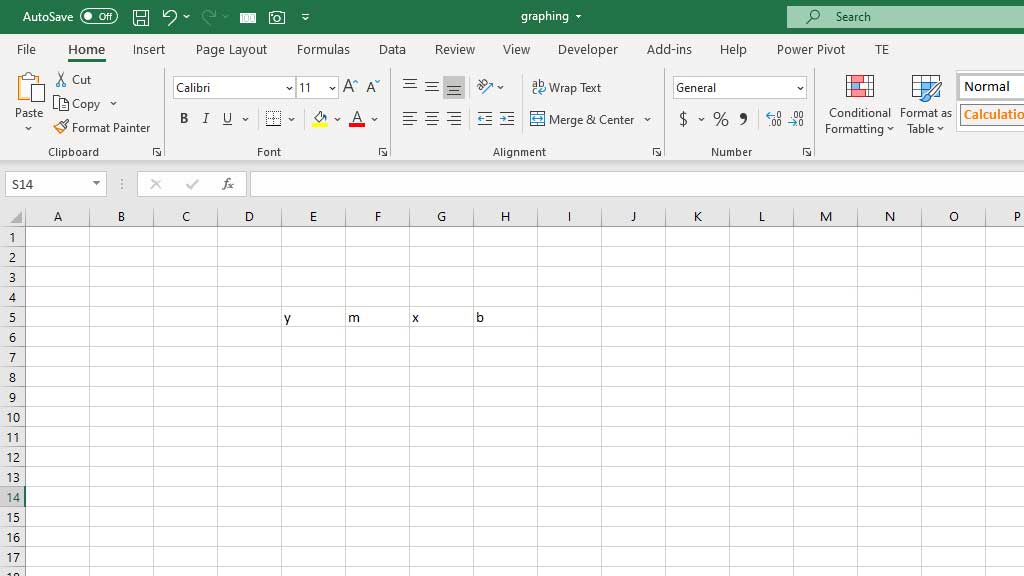
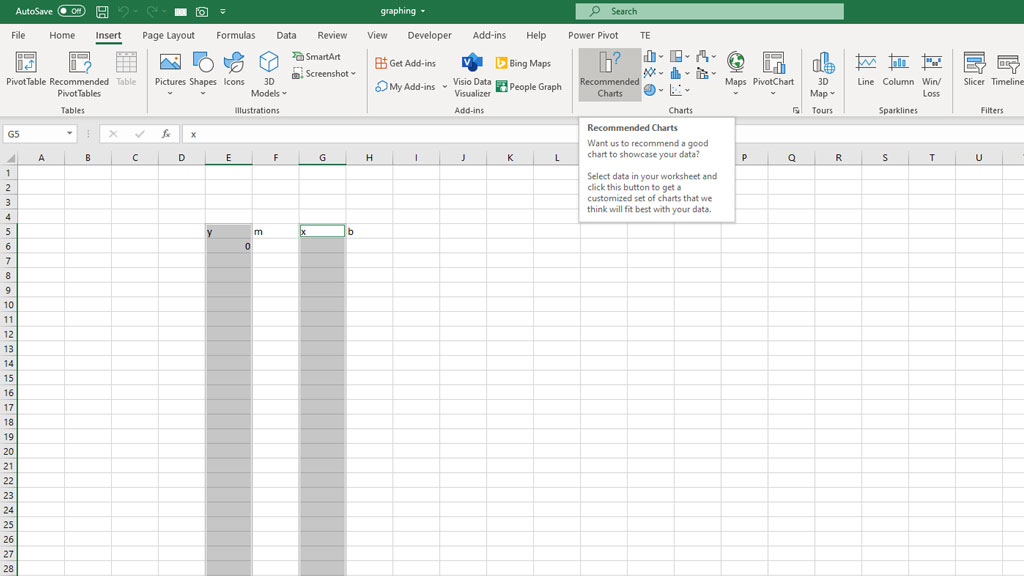
Let’s say, we want to graph the equation of y=mx+c. It’s a simple linear equation. You can follow the steps to graph an equation in excel without data.
First, select the cells you want to input the data in the future. Then, write the components of the equation as shown in the picture.
Step 2# Inputting the Calculation
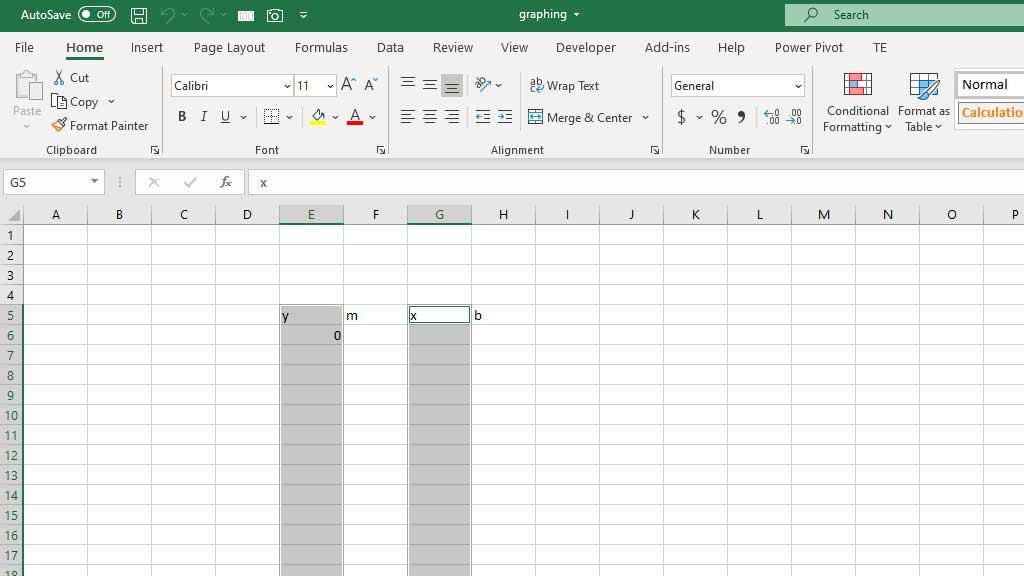
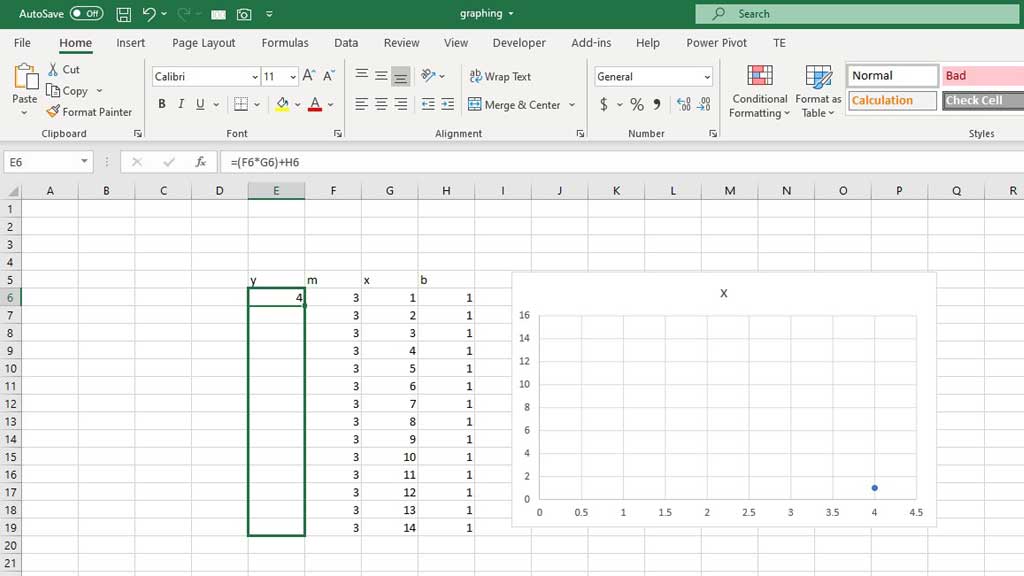
Now, the next step would be to tell Excel how the calculation of the equation would work. So, let’s imagine y
is in cell E5, m is in cell F5, x is in cell G5 and b is in cell H5.
So, you have to input the calculation of y in cell E6.
The calculation in Excel is- (F6*G6) +H6
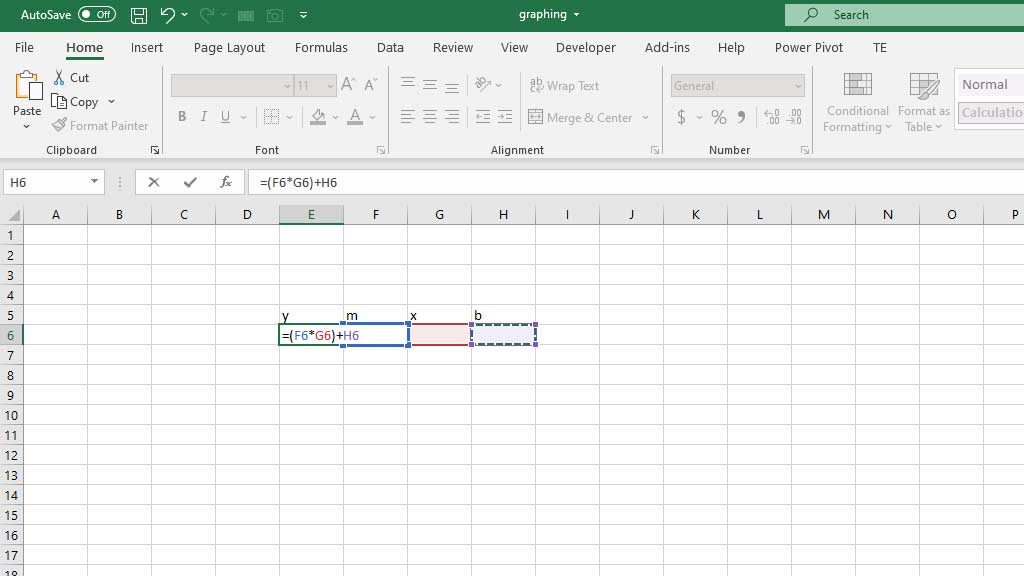
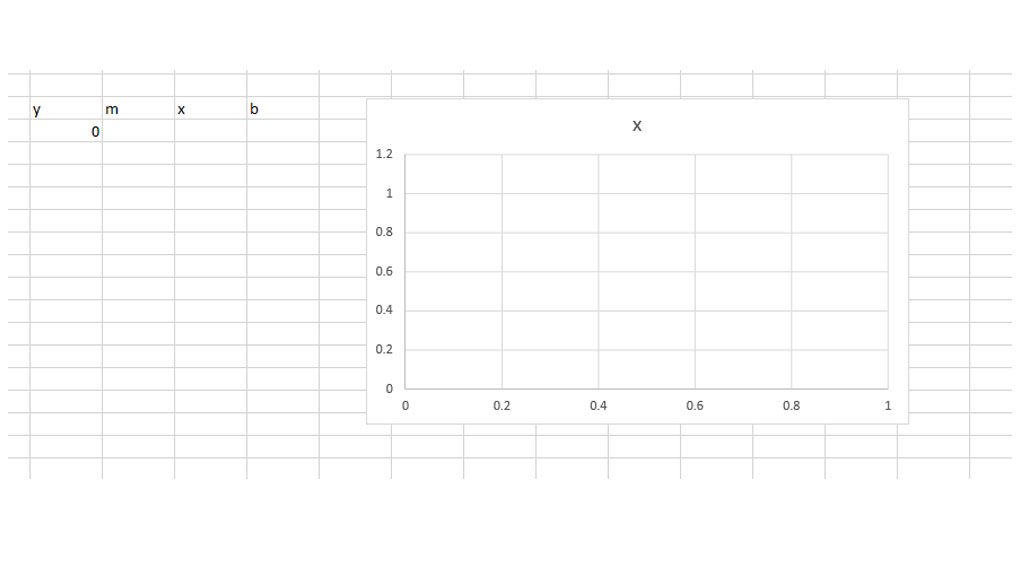
There you have it. Your equation is ready.
Step 3# Graph the equation
Now, to graph the equation, select the cell that contains y (cell E5). Now, hold CTRL+shift and hit the down arrow key twice to select the whole column.
Then, hitting the CTRL key select the cell that contains x (cell G5). again hold CTRL+shift and hit down arrow key twice to select the whole column.
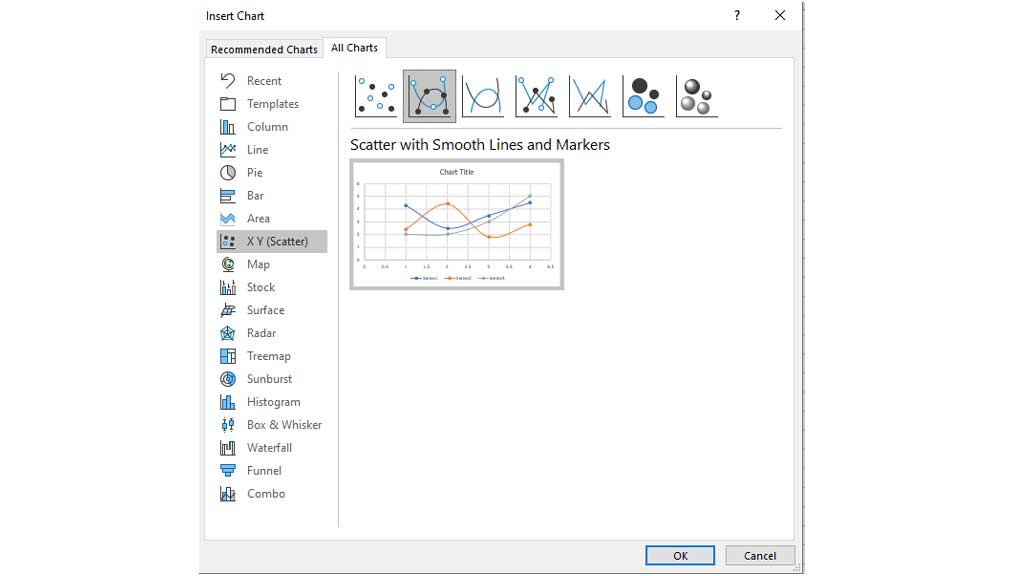
Then go to insert and from the chart tools select “recommended charts.”
After selecting recommended charts, a dialogue box will appear. From that box, go to the “All Charts” tab and select “X Y (Scatter).” You will be given multiple options to select from. You can choose anyone.
But I use the second chart “Scatter with smooth line and markers” and press ok.
There you have it, your equation’s graph without any data is ready.
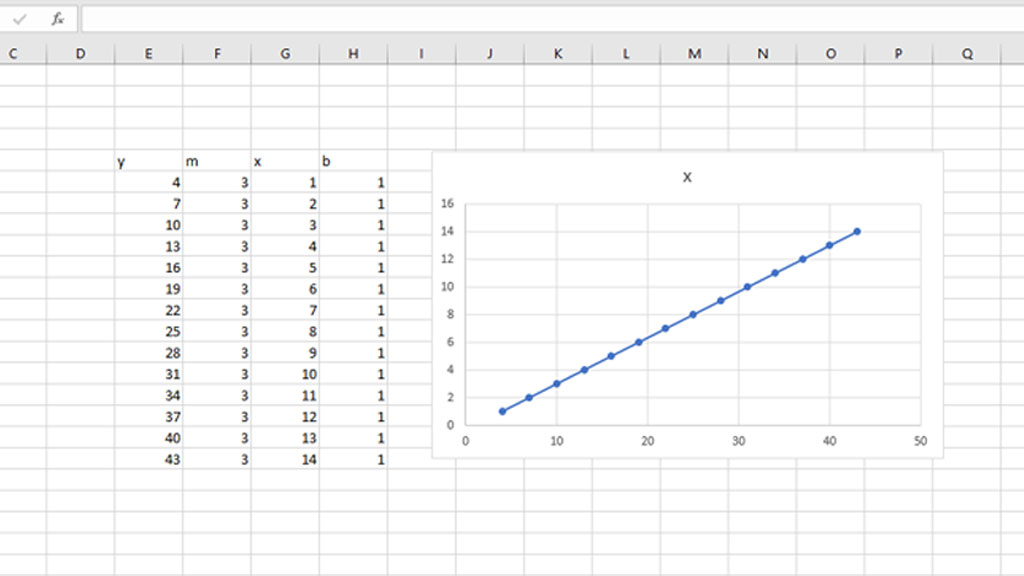
Now, when you input the data your graph will look like this.
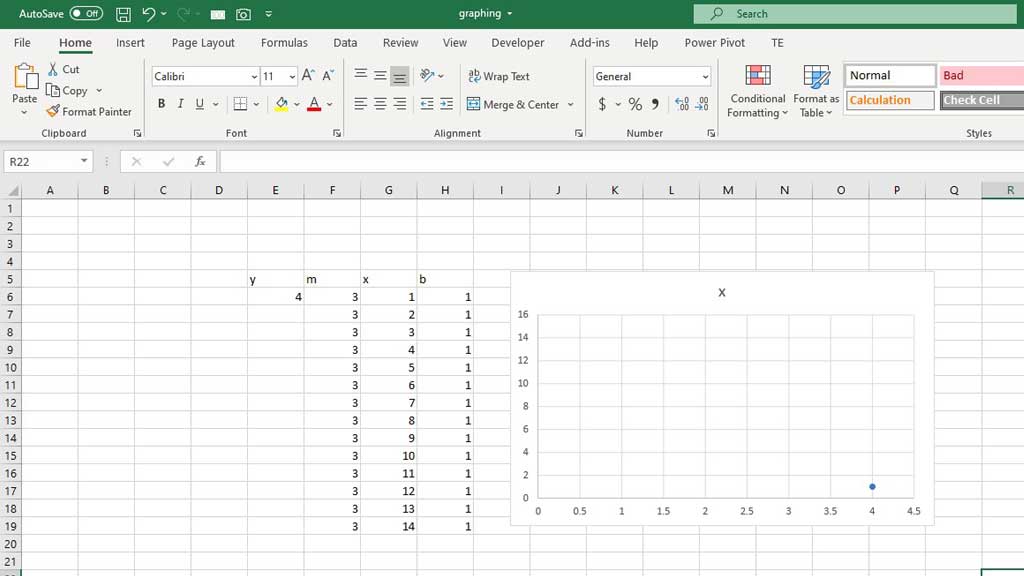
But don’t get scared, you just need to select the first result of y and drag the AutoFill option to fill the columns.
And there you have it, a beautiful graph plotting the equaiton of y=mx+c.
Following these steps, you can plot any equation’s graph in excel without data and when you get the data, just input in the right cells and voila, you get a beautiful graph.
You can use these steps to stay ahead of your peers and graph equations without any data and make your life easier and faster.

Hi there, I am Naimuz Saadat. I am an undergrad studying finance and banking. My academic and professional aspects have led me to revere Microsoft Excel. So, I am here to create a community that respects and loves Microsoft Excel. The community will be fun, helpful, and respectful and will nurture individuals into great excel enthusiasts.