Excel is spreadsheet software that is primarily used for data analysis, accounting, and statistical methods. However, it is possible to tweak excel into doing other fascinating things.
For example, you can make a graph paper in excel.
Graph papers are often required to plot data points, functions, or equations and are regularly used in school exams or other research purposes.
Graph papers are available in the market in many forms and sizes. But graph papers can also be made in Excel and printed.
Sometimes graph papers are also called dot grid papers.
So, let’s see how to make graph paper in excel.
How to Make Graph Paper in Excel?
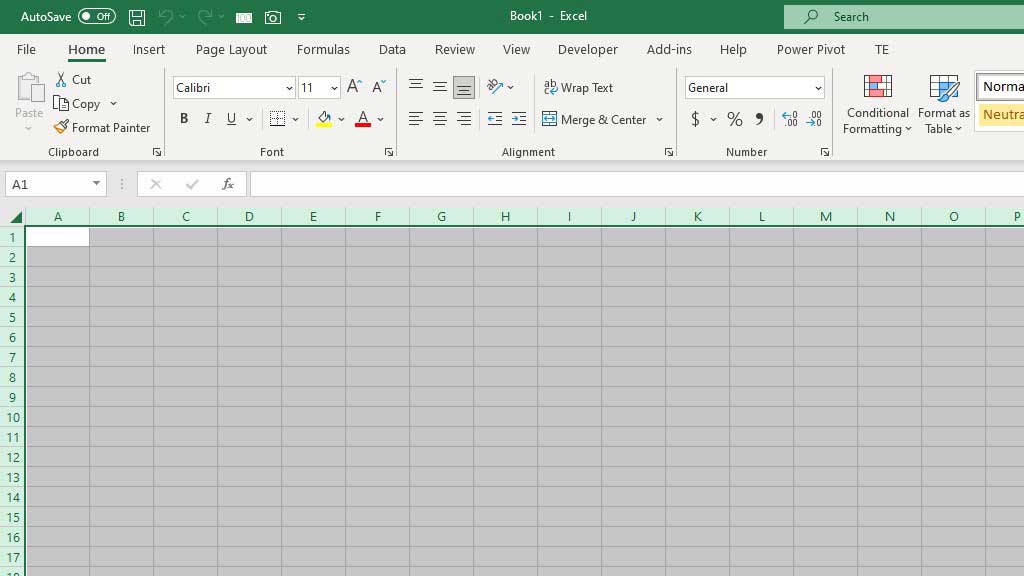
Step#1 Take a Blank Sheet and Select All the Cells
First, open a blank sheet and then select all the cells in the sheet.
To select all the cells in a sheet you can use the shortcut CTRL+A.
Step#2 Formatting Row Height
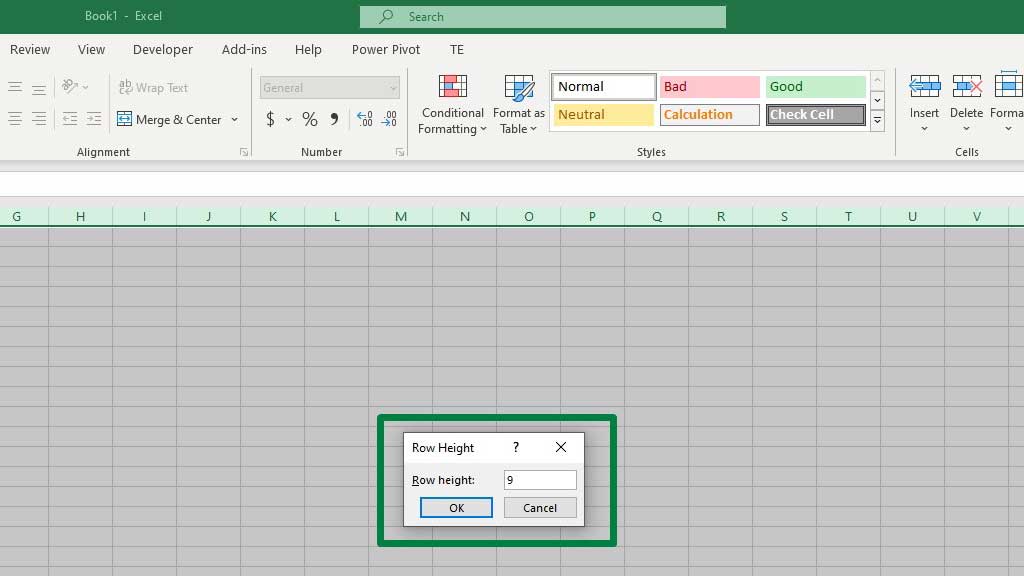
Now, select any of the rows, right-click, and select Row Height.
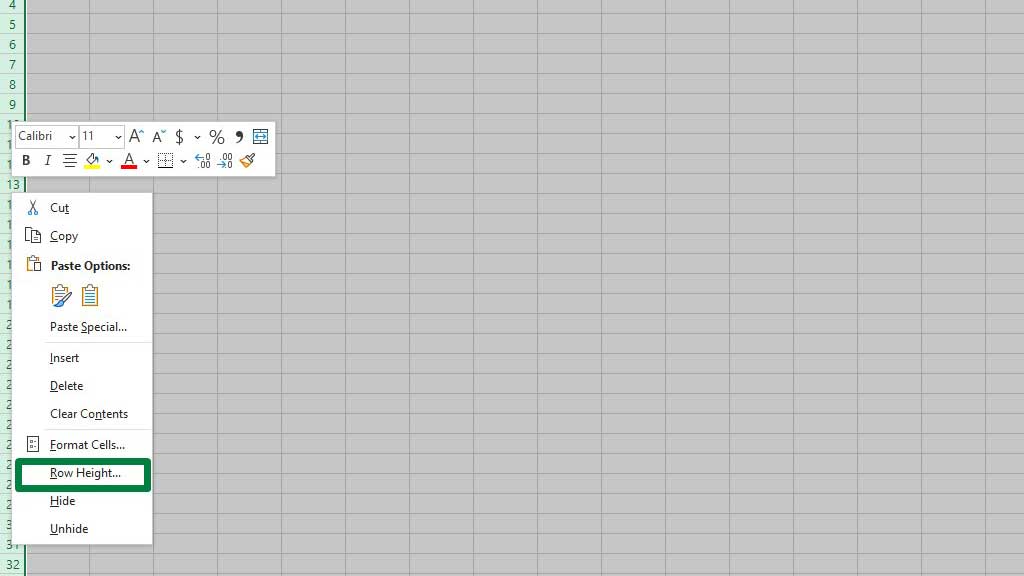
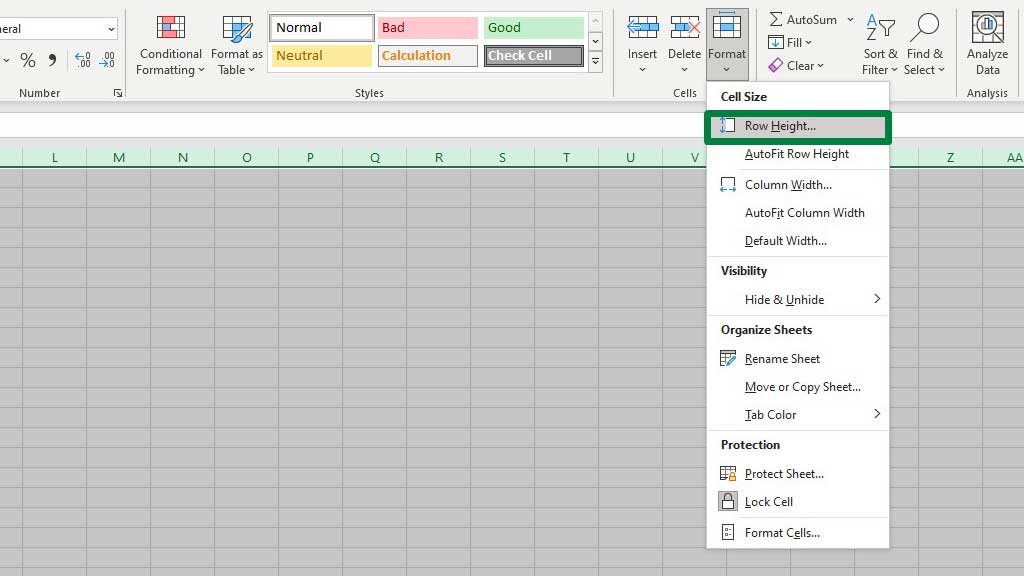
You can also go to the Row Height menu from the Home ribbon’s Format options.
Set the row height to 9.
Step#3 Formatting Column Width
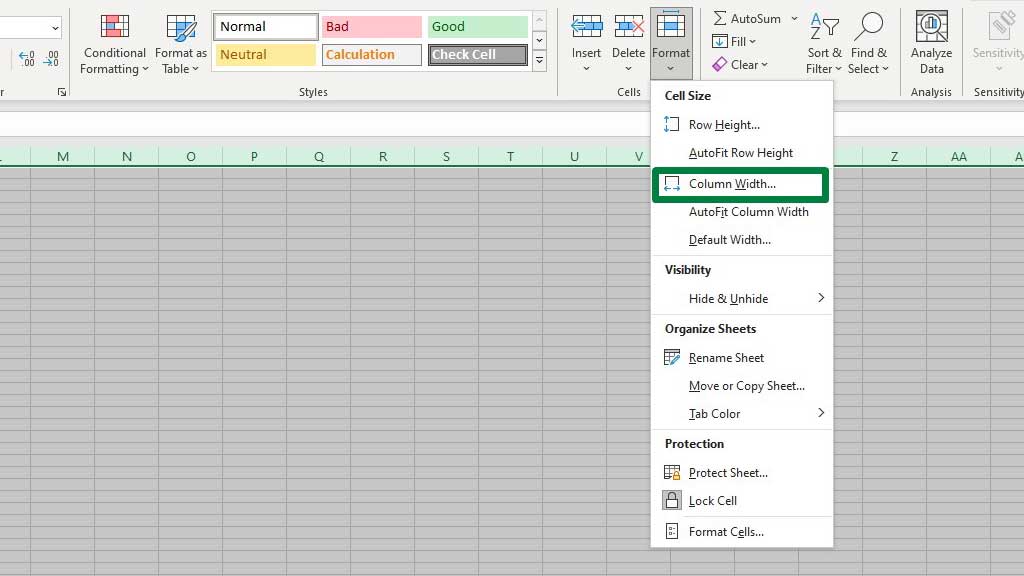
Now, select any of the columns, right-click, and select Column Width.
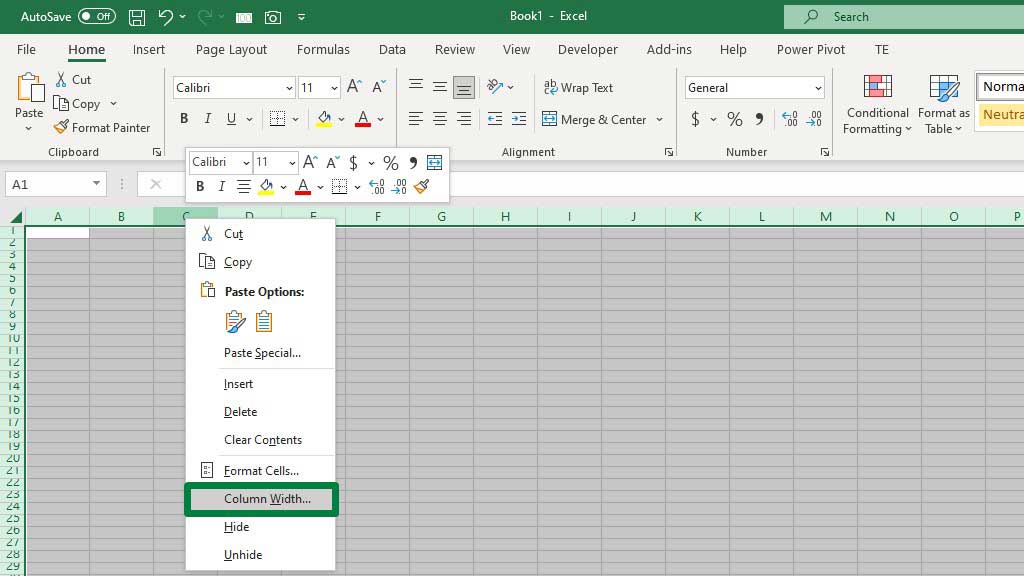
You can also go to the Column Width menu from the Home ribbon’s Format options.
Set the column width to 1.
You will notice that the cells are now perfect squares, exactly like the requirements of graph paper.
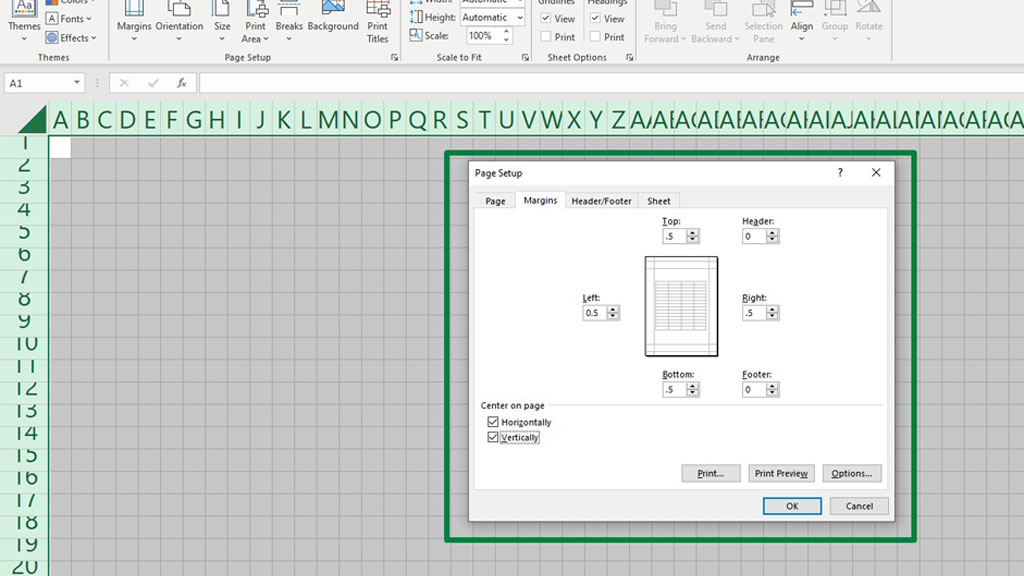
Step#4 Setting Up Margins
From the Page Layout ribbon, go to Margins and select Custom Margins.
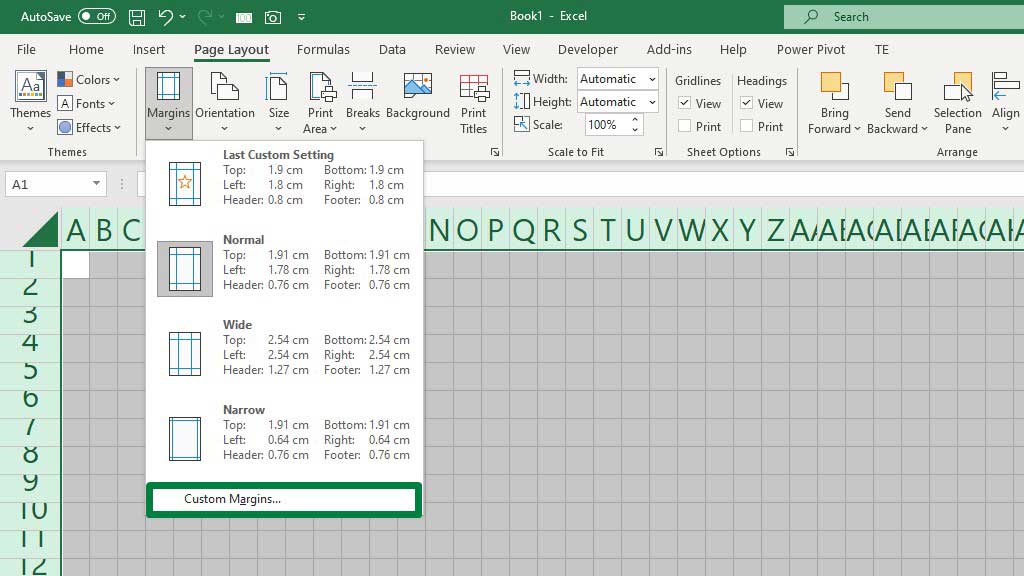
Set all margins (top, bottom, left, and tight) to .5. Set header and footer to 0.
Enable Horizontally and Vertically to center the page.
Now from the same dialogue box go to the Sheet tab and enable Gridlines.
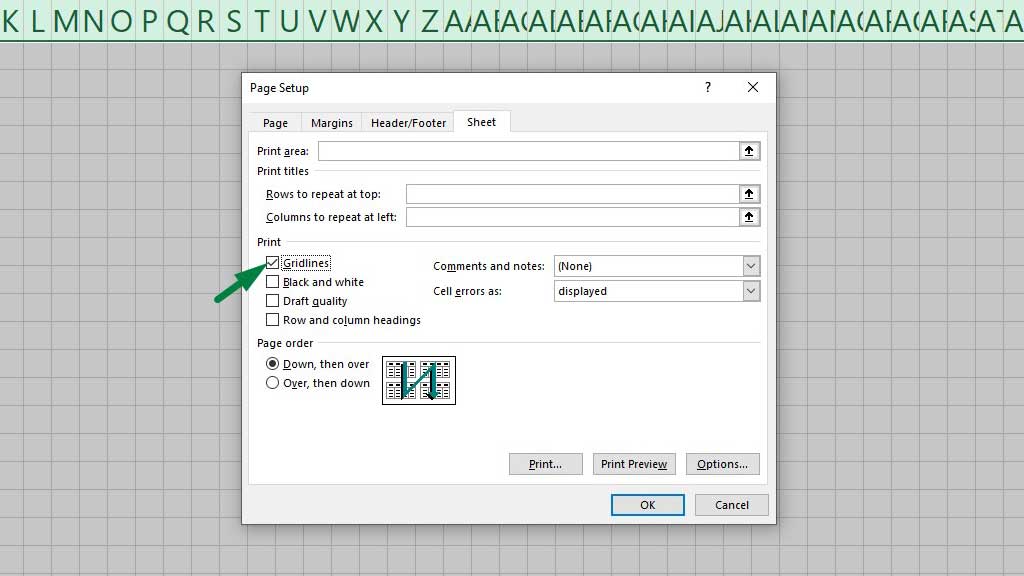
Press ok and your graph paper is ready for printing.
We covered the basics of printing in excel in another blog. Now, let’s see how to print a graph paper or dot grid paper in excel.
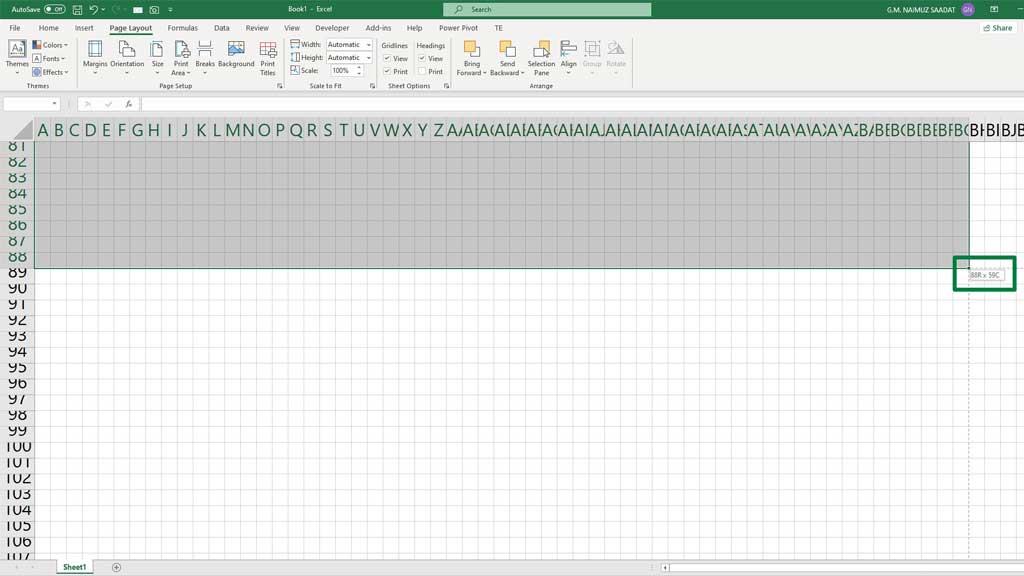
Step#5 Printing the Graph Paper
Select 88 rows and 58 columns (88r X 59c) and press CTRL+P to go to the print preview section.
Usually, graph paper is printed on A4 paper. Select A4 from the settings.
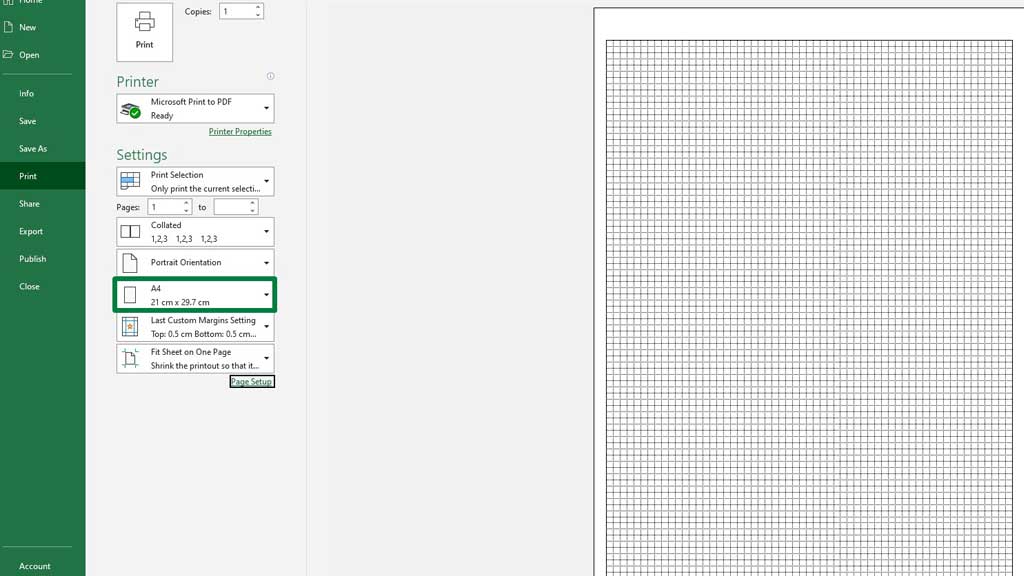
Now, the graph paper or the dot grid paper is ready to be printed in excel.
You can select how many copies you want to print as well. Print the graph papers or dot grid papers you made as per your requirements.
If you want darker borders, you can also add all borders from the home ribbon.
For your convenience, the graph paper template has been attached to this blog, you can download it for free and print as many as you want.
So, there you go, now you can make graph paper in excel.
Conclusion
Graph papers or dot grid papers are frequently needed to plot coordinates, graphs, etc. Engineers, economists, and mathematicians regularly use graph papers.
So, it is a piece of essential equipment with mathematical implications.
As now you know, how to make graph paper in excel, if you run out of them you can quickly make them at home as per your will.

Hi there, I am Naimuz Saadat. I am an undergrad studying finance and banking. My academic and professional aspects have led me to revere Microsoft Excel. So, I am here to create a community that respects and loves Microsoft Excel. The community will be fun, helpful, and respectful and will nurture individuals into great excel enthusiasts.